
Page 136 - 2017食品藥物管理署年報(英文版)
P. 136
2017 Taiwan Food and Drug Administration Annual Report
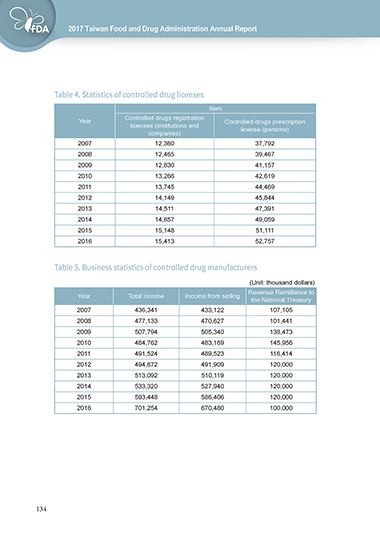
Table 4. Statistics of controlled drug licenses
Item
Year Controlled drugs registration Controlled drugs prescription
licenses (institutions and license (persons)
companies)
2007 12,360 37,792
2008 12,465 39,467
2009 12,830 41,157
2010 13,266 42,619
2011 13,745 44,469
2012 14,149 45,844
2013 14,511 47,391
2014 14,857 49,059
2015 15,148 51,111
2016 15,413 52,757
Table 5. Business statistics of controlled drug manufacturers
(Unit: thousand dollars)
Revenue Remittance to
Year Total income Income from selling
the National Treasury
2007 436,341 433,122 107,105
2008 477,133 470,627 101,441
2009 507,794 505,340 138,473
2010 484,762 483,169 145,956
2011 491,524 489,523 116,414
2012 494,672 491,909 120,000
2013 513,092 510,119 120,000
2014 533,320 527,940 120,000
2015 593,448 586,406 120,000
2016 701,254 670,480 100,000
134