
Page 138 - 2017食品藥物管理署年報(英文版)
P. 138
2017 Taiwan Food and Drug Administration Annual Report
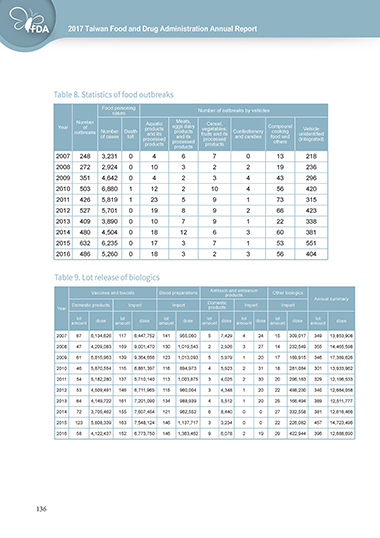
Table 8. Statistics of food outbreaks
Food poisoning Number of outbreaks by vehicles
cases
Number Aquatic Meats, Cereal,
Year of products eggs dairy vegetables, Compound Vehicle
outbreaks Number Death and its products fruits and its Confectionery cooking unidentified
of cases toll and its and candies food and
processed processed processed others (Integrated)
products products
products
2007 248 3,231 0 4 6 7 0 13 218
2008 272 2,924 0 10 3 2 2 19 236
2009 351 4,642 0 4 2 3 4 43 296
2010 503 6,880 1 12 2 10 4 56 420
2011 426 5,819 1 23 5 9 1 73 315
2012 527 5,701 0 19 8 9 2 66 423
2013 409 3,890 0 10 7 9 1 22 338
2014 480 4,504 0 18 12 6 3 60 381
2015 632 6,235 0 17 3 7 1 53 551
2016 486 5,260 0 18 3 2 3 56 404
Table 9. Lot release of biologics
Vaccines and toxoids Blood preparations Antitoxin and antiserum Other biologics
products
Annual summary
Domestic
Domestic products Import Import Import Import
Year products
lot dose lot dose lot dose lot dose lot dose lot dose lot dose
amount amount amount amount amount amount amount
2007 67 6,134,626 117 6,447,752 141 955,060 5 7,429 4 24 15 309,017 349 13,853,908
2008 47 4,209,083 159 9,001,470 130 1,019,543 2 2,926 3 27 14 232,549 355 14,465,598
2009 61 6,815,963 139 9,364,656 123 1,013,093 5 5,979 1 20 17 189,915 346 17,389,626
2010 46 5,870,554 115 6,881,397 116 894,973 4 5,923 2 31 18 281,084 301 13,933,962
2011 54 5,182,280 137 5,710,140 113 1,003,875 3 4,025 2 30 20 296,183 329 12,196,533
2012 53 4,509,491 146 6,711,965 115 960,004 3 4,348 1 20 22 498,230 340 12,684,058
2013 64 4,149,722 161 7,201,090 134 988,939 4 5,512 1 20 25 166,494 389 12,511,777
2014 72 3,705,462 155 7,607,454 121 962,552 6 8,440 0 0 27 332,558 381 12,616,466
2015 123 5,808,339 163 7,548,124 146 1,137,717 3 3,234 0 0 22 226,082 457 14,723,496
2016 58 4,122,437 152 6,773,750 146 1,363,462 9 6,078 2 19 29 422,944 396 12,688,690
136