
Page 135 - 2017食品藥物管理署年報(英文版)
P. 135
2017 Taiwan Food and Drug Administration Annual Report Annex
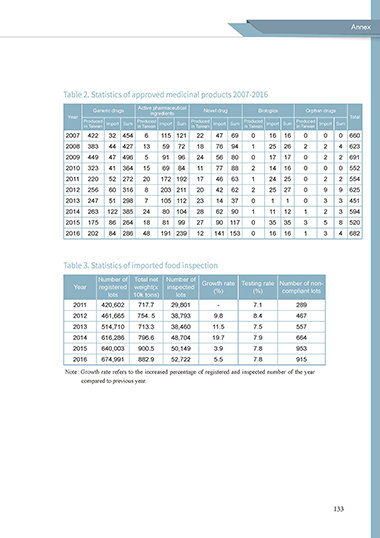
Table 2. Statistics of approved medicinal products 2007-2016
Generic drugs Active pharmaceutical Novel drug Biologics Orphan drugs
ingredients
Year Total
Produced Import Sum Produced Import Sum Produced Import Sum Produced Import Sum Produced Import Sum
in Taiwan in Taiwan in Taiwan in Taiwan in Taiwan
2007 422 32 454 6 115 121 22 47 69 0 16 16 0 0 0 660
2008 383 44 427 13 59 72 18 76 94 1 25 26 2 2 4 623
2009 449 47 496 5 91 96 24 56 80 0 17 17 0 2 2 691
2010 323 41 364 15 69 84 11 77 88 2 14 16 0 0 0 552
2011 220 52 272 20 172 192 17 46 63 1 24 25 0 2 2 554
2012 256 60 316 8 203 211 20 42 62 2 25 27 0 9 9 625
2013 247 51 298 7 105 112 23 14 37 0 1 1 0 3 3 451
2014 263 122 385 24 80 104 28 62 90 1 11 12 1 2 3 594
2015 175 86 264 18 81 99 27 90 117 0 35 35 3 5 8 520
2016 202 84 286 48 191 239 12 141 153 0 16 16 1 3 4 682
Table 3. Statistics of imported food inspection
Number of Total net Number of
Year registered weight(x inspected Growth rate Testing rate Number of non-
(%)
compliant lots
(%)
lots 10k tons) lots
2011 420,602 717.7 29,801 - 7.1 289
2012 461,665 754. 5 38,793 9.8 8.4 467
2013 514,710 713.3 38,460 11.5 7.5 557
2014 616,286 796.6 48,704 19.7 7.9 664
2015 640,003 900.5 50,149 3.9 7.8 953
2016 674,991 882.9 52,722 5.5 7.8 915
Note : Growth rate refers to the increased percentage of registered and inspected number of the year
compared to previous year.
133