Page 137 - 2017食品藥物管理署年報(英文版)
P. 137

2017 Taiwan Food and Drug Administration Annual Report                                                        Annex


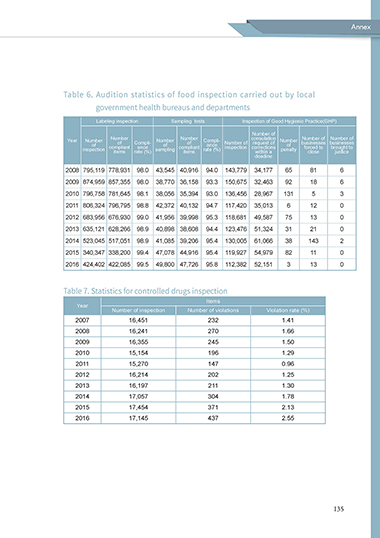
                     Table 6. Audition statistics of food inspection carried out by local

                               government health bureaus and departments
                               Labeling inspection     Sampling  tests       Inspection of Good Hygienic Practice(GHP)

                                                                                Number of
                                                                                consulation
                                                                                                Number of  Number of
                      Year  Number   Number       Number   Number   Compli-   Number of  request of   Number   businesses  businesses
                                                            of
                              of      of   Compli-  of   compliant   ance   inspection corrections   of   forced to   brought to
                           inspection  compliant   ance   sampling  rate (%)             penalty
                                     items  rate (%)      items                  within a        close    justice
                                                                                 deadine
                      2008 795,119  778,931  98.0  43,545 40,916  94.0  143,779  34,177   65      81        6
                      2009 874,959  857,355  98.0  38,770 36,158  93.3  150,675  32,463   92      18        6
                      2010 796,758  781,645  98.1  38,056 35,394  93.0  136,456  28,967   131      5        3
                      2011 806,324  796,795  98.8  42,372 40,132  94.7  117,420  35,013    6      12        0

                      2012 683,956  676,930  99.0  41,956 39,998  95.3  118,681  49,587   75      13        0
                      2013 635,121  628,266  98.9  40,898 38,608  94.4  123,476  51,324   31      21        0
                      2014 523,045  517,051  98.9  41,085  39,206  95.4  130,005  61,066   38     143       2

                      2015 340,347 338,200  99.4  47,078 44,916   95.4  119,927  54,979   82      11        0
                      2016 424,402 422,085  99.5  49,800 47,726   95.8  112,382  52,151    3      13        0


                     Table 7. Statistics for controlled drugs inspection
                                                                  Items
                         Year
                                    Number of inspection    Number of violations     Violation rate (%)
                         2007            16,451                   232                    1.41
                         2008            16,241                   270                    1.66
                         2009            16,355                   245                    1.50
                         2010            15,154                   196                    1.29
                         2011            15,270                   147                    0.96
                         2012            16,214                   202                    1.25

                         2013            16,197                   211                    1.30
                         2014            17,057                   304                    1.78
                         2015            17,454                   371                    2.13
                         2016            17,145                   437                    2.55


                                                                                                          135
   132   133   134   135   136   137   138   139   140   141   142