
Page 149 - 2023 Taiwan Food and Drug Administration Annual Report
P. 149
7Appendix
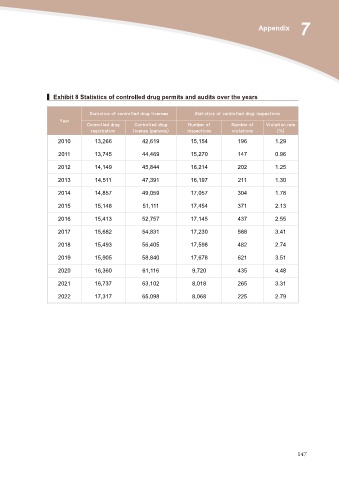
▍ Exhibit 8 Statistics of controlled drug permits and audits over the years
Statistics of controlled drug licenses Statistics of controlled drug inspections
Year Controlled drug Controlled drug Number of Number of Violation rate
registration license (persons) inspections violations (%)
2010
2011 13,266 42,619 15,154 196 1.29
2012
2013 13,745 44,469 15,270 147 0.96
2014
2015 14,149 45,844 16,214 202 1.25
2016
2017 14,511 47,391 16,197 211 1.30
2018
2019 14,857 49,059 17,057 304 1.78
2020
2021 15,148 51,111 17,454 371 2.13
2022
15,413 52,757 17,145 437 2.55
15,682 54,831 17,230 588 3.41
15,493 56,405 17,598 482 2.74
15,905 58,840 17,678 621 3.51
16,360 61,116 9,720 435 4.48
16,737 63,102 8,018 265 3.31
17,317 65,098 8,068 225 2.79
147