
Page 152 - 2023 Taiwan Food and Drug Administration Annual Report
P. 152
2023 Taiwan Food and
Drug Administration
Annual Report
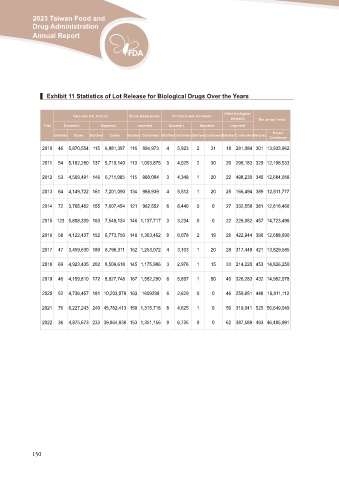
▍ Exhibit 11 Statistics of Lot Release for Biological Drugs Over the Years
Vaccines and toxoids Blood preparations Antitoxin and antiserum Other biological The annual total
Imported products
Year Domestic Imported Domestic Imported
Imported
Batches Doses Batches Doses Batches Containers BatchesContainersBatchesContainers Batches Containers Batches Doses/
Containers
2010 46 5,870,554 115 6,881,397 116 894,973 4 5,923 2 31 18 281,084 301 13,933,962
2011 54 5,182,280 137 5,710,140 113 1,003,875 3 4,025 2 30 20 296,183 329 12,196,533
2012 53 4,509,491 146 6,711,965 115 960,004 3 4,348 1 20 22 498,230 340 12,684,058
2013 64 4,149,722 161 7,201,090 134 988,939 4 5,512 1 20 25 166,494 389 12,511,777
2014 72 3,705,462 155 7,607,454 121 962,552 6 8,440 0 0 27 332,558 381 12,616,466
2015 123 5,808,339 163 7,548,124 146 1,137,717 3 3,234 0 0 22 226,082 457 14,723,496
2016 58 4,122,437 152 6,773,750 146 1,363,462 9 6,078 2 19 29 422,944 396 12,688,690
2017 47 3,459,630 189 8,796,311 152 1,253,072 4 3,103 1 20 28 317,449 421 13,829,585
2018 69 4,923,435 202 8,509,618 145 1,175,986 3 2,976 1 15 33 214,220 453 14,826,250
2019 46 4,159,810 172 8,927,748 167 1,562,290 6 5,897 1 50 40 326,283 432 14,982,078
2020 52 4,736,457 181 10,203,078 163 1609298 6 2,629 0 0 46 259,651 448 16,811,113
2021 76 9,227,243 240 45,782,413 150 1,315,718 8 4,625 1 9 50 319,041 525 56,649,049
2022 36 4,875,673 233 39,864,838 153 1,351,156 9 6,735 0 0 62 387,589 493 46,485,991
150