
Page 144 - 2023 Taiwan Food and Drug Administration Annual Report
P. 144
2023 Taiwan Food and
Drug Administration
Annual Report
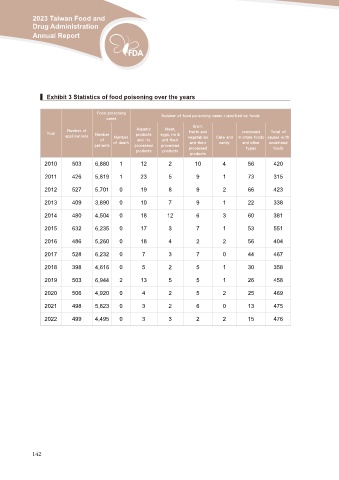
▍ Exhibit 3 Statistics of food poisoning over the years
Food poisoning Number of food poisoning cases classified by foods
cases
Year Number of Number Aquatic Meat, Grain, compound Total of
applications of products eggs, milk fruits and
2010 Number and its and their vegetables Cake and mixture foods causes with
patients of death processed processed and their candy
products products processed and other undefined
products
types foods
503 6,880 1 12 2 10 4 56 420
2011 426 5,819 1 23 5 9 1 73 315
2012 527 5,701 0 19 8 9 2 66 423
2013 409 3,890 0 10 7 9 1 22 338
2014 480 4,504 0 18 12 6 3 60 381
2015 632 6,235 0 17 3 7 1 53 551
2016 486 5,260 0 18 4 2 2 56 404
2017 528 6,232 0 7 3 7 0 44 467
2018 398 4,616 0 5 2 5 1 30 358
2019 503 6,944 2 13 5 5 1 26 458
2020 506 4,920 0 4 2 5 2 25 469
2021 498 5,823 0 3 2 6 0 13 475
2022 499 4,495 0 3 3 2 2 15 476
142