
Page 142 - 2023 Taiwan Food and Drug Administration Annual Report
P. 142
2023 Taiwan Food and
Drug Administration
Annual Report
Appendix 3. Iomvpeor rtthaenyt eaacrhsievements and statistics
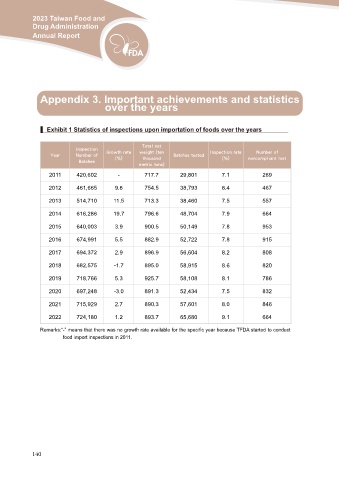
▍ Exhibit 1 Statistics of inspections upon importation of foods over the years
Year Inspection Growth rate Total net Batches tested Inspection rate Number of
Number of (%) weight (ten (%) noncompliant lost
2011
Batches thousand
metric tons)
420,602
- 717.7 29,801 7.1 289
2012 461,665 9.8 754.5 38,793 8.4 467
2013 514,710 11.5 713.3 38,460 7.5 557
2014 616,286 19.7 796.6 48,704 7.9 664
2015 640,003 3.9 900.5 50,149 7.8 953
2016 674,991 5.5 882.9 52,722 7.8 915
2017 694,372 2.9 896.9 56,604 8.2 808
2018 682,575 -1.7 895.0 58,915 8.6 820
2019 718,766 5.3 925.7 58,108 8.1 786
2020 697,248 -3.0 891.3 52,434 7.5 832
2021 715,929 2.7 890.3 57,601 8.0 846
2022 724,180 1.2 893.7 65,680 9.1 664
Remarks:“-” means that there was no growth rate available for the specific year because TFDA started to conduct
food import inspections in 2011.
140