
Page 143 - 2023 Taiwan Food and Drug Administration Annual Report
P. 143
7Appendix
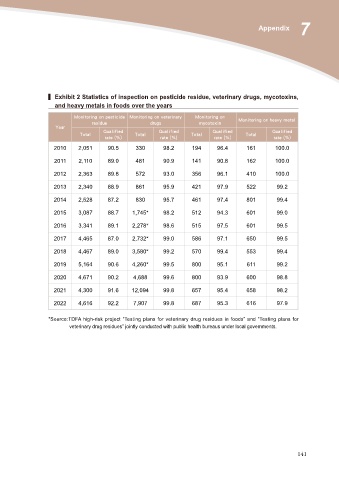
▍ Exhibit 2 Statistics of inspection on pesticide residue, veterinary drugs, mycotoxins,
and heavy metals in foods over the years
Monitoring on pesticide Monitoring on veterinary Monitoring on Monitoring on heavy metal
mycotoxin
Year residue drugs
Total Qualified Total Qualified Total Qualified Total Qualified
rate (%) rate (%) rate (%) rate (%)
2010 2,051 90.5 330 98.2 194 96.4 161 100.0
2011 2,110 89.0 481 90.9 141 90.8 162 100.0
2012 2,363 89.8 572 93.0 356 96.1 410 100.0
2013 2,340 88.9 861 95.9 421 97.9 522 99.2
2014 2,528 87.2 830 95.7 461 97.4 801 99.4
2015 3,087 88.7 1,745* 98.2 512 94.3 601 99.0
2016 3,341 89.1 2,278* 98.6 515 97.5 601 99.5
2017 4,465 87.0 2,732* 99.0 586 97.1 650 99.5
2018 4,467 89.0 3,580* 99.2 570 99.4 553 99.4
2019 5,164 90.6 4,260* 99.5 800 95.1 611 99.2
2020 4,671 90.2 4,688 99.6 800 93.9 600 98.8
2021 4,300 91.6 12,094 99.8 657 95.4 658 98.2
2022 4,616 92.2 7,907 99.8 687 95.3 616 97.9
*Source:TDFA high-risk project “Testing plans for veterinary drug residues in foods” and “Testing plans for
veterinary drug residues” jointly conducted with public health bureaus under local governments.
141