Page 134 - 2018食藥署年報(英文版)
P. 134

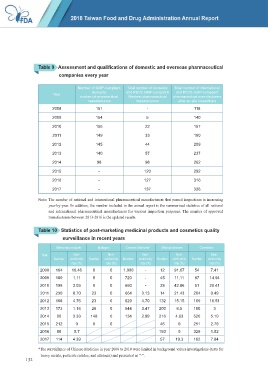
Table 9   Assessment and qualifications of domestic and overseas pharmaceutical
                           companies every year


                                    Number of GMP-compliant   Total number of domestic   Total number of international
                                          domestic       and PIC/S GMP-compliant   and PIC/S GMP-compliant
                         Year
                                     modern pharmaceutical   Western pharmaceutical   pharmaceutical manufacturers
                                        manufacturers        manufacturers      after on-site inspections
                        2008                151                   -                    118

                        2009                154                   5                    140
                        2010                155                   22                   157

                        2011                149                   33                   180
                        2012                145                   44                   209

                        2013                140                   57                   237
                        2014                98                    98                   262

                        2015                 -                   120                   292
                        2016                 -                   127                   316

                        2017                 -                   137                   326
                  Note: The number of national and international pharmaceutical manufacturers that passed inspections is increasing
                       year-by-year. In addition, the number included in the annual report is the summarized statistics of all national
                       and international pharmaceutical manufacturers for various inspection purposes. The number of approved
                       manufacturers between 2013-2016 is the updated results.


                  Table 10   Statistics of post-marketing medicinal products and cosmetics quality
                             surveillance in recent years

                          Medicinal products  Biologics  Chinese Medicine*  Medical devices  Cosmetics
                    Year          Non-           Non-           Non-           Non-            Non-
                         Number  conformity   Number  conformity   Number  conformity   Number  conformity   Number  conformity
                                 rate (%)       rate (%)       rate (%)       rate (%)        rate (%)
                   2008   164    16.46    0       0     1,000    -      12    91.67     54     7.41
                   2009   180    1.11     0       0      720     -      45     11.11    87    14.94
                   2010   198    3.03     0       0      660     -      28    42.86     51    29.41
                   2011   230    8.70     23      0      664    3.13    14    21.43    204     0.49

                   2012   168    4.76     23      0      629    4.70    132   15.15    109    16.51
                   2013   173    1.16     26      0      544    3.47    200    6.5     100      3
                   2014   90     3.33    148      0      134    2.99    216    4.63    520     5.19
                   2015   212      0      0       0                     46      0      251     2.79
                   2016   88      5.7                                   193     0      329     1.52
                   2017   114    4.39                                   57     19.3    102     7.84

                  *The surveillance of Chinese Medicine in year 2008 to 2010 were limited in background values investigations (tests for
                   heavy metals, pesticide residue, and aflatozin) and presented as “-”.
            132
   129   130   131   132   133   134   135   136   137   138   139