Page 133 - 2018食藥署年報(英文版)
P. 133

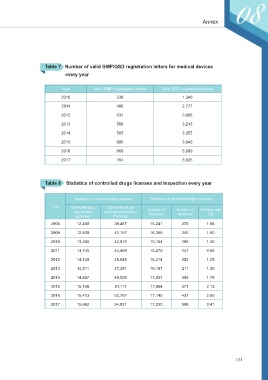
Table 7   Number of valid GMP/QSD registration letters for medical devices
                              every year


                            Year           Valid GMP registration letters  Valid QSD registration letters
                            2010                     236                          1,340

                            2011                     486                          2,777
                            2012                     531                          3,065

                            2013                     568                          3,213
                            2014                     565                          3,057
                            2015                     685                          3,640

                            2016                     669                          3,800

                            2017                     704                          3,925


                     Table 8    Statistics of controlled drugs licenses and inspection every year


                                  Statistics of controlled drug licenses  Statistics of controlled drugs inspection
                        Year    Controlled drug   Controlled drugs
                                  registration   prescription licenses   Number of   Number of   Violation rate
                                   (License)       (Persons)       inspection   violations   (%)
                        2008       12,465           39,467          16,241        270        1.66

                        2009       12,830           41,157          16,355        245        1.50
                        2010       13,266           42,619          15,154        196        1.29

                        2011       13,745           44,469          15,270        147        0.96
                        2012       14,149           45,844          16,214        202        1.25

                        2013       14,511           47,391          16,197        211        1.30
                        2014       14,857           49,059          17,057        304        1.78
                        2015       15,148           51,111          17,454        371        2.13

                        2016       15,413           52,757          17,145        437        2.55

                        2017       15,682           54,831          17,230        588        3.41


                                                                                                          131
   128   129   130   131   132   133   134   135   136   137   138