Page 132 - 2018食藥署年報(英文版)
P. 132

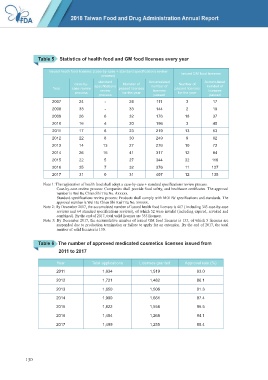
Table 5    Statistics of health food and GM food licenses every year


                       Issued heath food licenses (case-by-case + standard specifications review   Issued GM food licenses
                                              process)
                                             standard              Accumulated              Accumulated
                                  case-by-              Number of               Number of
                         Year    case review   specifications   passed licenses   number of   passed licenses   number of
                                                                     licenses
                                             review
                                                                                              licenses
                                  process              for the year             for the year
                                             process                 passed                   passed
                        2007        24          -         24          111           3           17
                        2008        33          -         33          144           2           19
                        2009        26         6          32          176          18           37
                        2010        16         4          20          196           3           40
                        2011        17         6          23          219          13           53
                        2012        22         8          30          249           9           62
                        2013        14         13         27          276          10           72
                        2014        26         15         41          317          12           84
                        2015        22         5          27          344          32          116
                        2016        25         7          32          376          11          127
                        2017        31         0          31          407          12          135
                    Note 1: The registration of health food shall adopt a case-by-case + standard specifications review process.
                          Case-by-case review process: Companies shall provide food safety, and healthcare certificates. The approval
                          number is Wei Bu Chien Shi Tzu No. Axxxxx.
                          Standard specifications review process: Products shall comply with MOHW specifications and standards. The
                          approval number is Wei Bu Chien Shi Kui Tzu No. xxxxxx.
                    Note 2: By December 2017, the accumulated number of issued health food licenses is 407 ( including 343 case-by-case
                          reviews and 64 standard specifications reviews), of which 52 were invalid (including expired, revoked and
                          combined). By the end of 2017, total valid licenses are 355 licenses.
                    Note 3: By December 2017, the accumulative number of issued GM food licenses is 135, of which 5 licenses are
                          suspended due to production termination or failure to apply for an extension. By the end of 2017, the total
                          number of valid licenses is 130.

                  Table 6   The number of approved medicated cosmetics licenses issued from

                           2011 to 2017

                          Year            Total applications   Licenses granted    Approval rate (%)
                          2011                 1,634                1,519               93.0

                          2012                 1,721                1,482               86.1
                          2013                 1,650                1,506               91.3

                          2014                 1,900                1,661               87.4
                          2015                 1,822                1,558               85.5

                          2016                 1,484                1,268               84.1
                          2017                 1,499                1,255               85.4


            130
   127   128   129   130   131   132   133   134   135   136   137