Page 136 - 2018食藥署年報(英文版)
P. 136

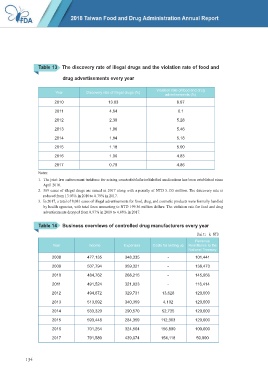
Table 13   The discovery rate of illegal drugs and the violation rate of food and

                             drug advertisements every year


                          Year         Discovery rate of illegal drugs (%)  Violation rate of food and drug
                                                                          advertisements (%)
                         2010                    13.03                          8.97
                         2011                     4.64                          6.1
                         2012                     2.30                          5.28

                         2013                     1.96                          5.46

                         2014                     1.84                          5.18
                         2015                     1.18                          5.00
                         2016                     1.06                          4.83

                         2017                     0.79                          4.86
                  Notes:
                  1.  The joint law enforcement taskforce for seizing counterfeit/inferior/falsified medications has been established since
                    April 2010.
                  2.  369 cases of illegal drugs are seized in 2017 along with a penalty of NTD 5.155 million. The discovery rate is
                    reduced from 13.03% in 2010 to 0.79% in 2017.
                  3.  In 2017, a total of 8,081 cases of illegal advertisements for food, drug, and cosmetic products were formally handled
                    by health agencies, with total fines amounting to NTD 199.36 million dollars. The violation rate for food and drug
                    advertisements dropped from 8.97% in 2010 to 4.86% in 2017.


                  Table 14    Business overviews of controlled drug manufacturers every year
                                                                                        Unit: k NTD
                                                                                        Revenue
                         Year           Income          Expenses     Costs for setting up  Remittance to the
                                                                                     National Treasury
                        2008            477,135          348,335           -            101,441

                        2009            507,794          359,321           -            138,473
                        2010            484,762          268,215           -            145,956

                        2011            491,524          321,823           -            116,414
                        2012            494,672          329,731         13,628         120,000

                        2013            513,092          340,359          4,102         120,000
                        2014            533,320          290,570         52,735         120,000

                        2015            593,448          284,359         112,303        120,000
                        2016            701,254          324,564        156,890         100,000

                        2017            791,580          439,074         154,118        50,000


            134
   131   132   133   134   135   136   137   138   139   140   141