
Page 135 - 2018食藥署年報(英文版)
P. 135
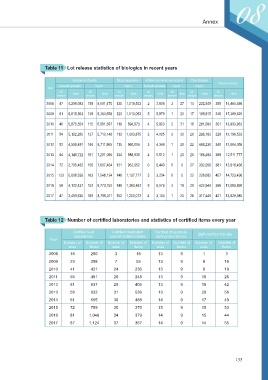
Table 11   Lot release statistics of biologics in recent years


                                 Vaccines and toxoids  Blood preparations  Antitoxin and antiserum products  Other biologics
                                                                                                  Annual summary
                           Domestic products  Import    Import   Domestic products  Import  Import
                      Year
                            lot   dose   lot   dose  lot   dose   lot   dose  lot   dose  lot   dose  lot   dose
                          amount       amount       amount       amount     amount  amount      amount
                      2008  47  4,209,083  159  9,001,470  130  1,019,543  2  2,926  3  27  14  232,549  355  14,465,598

                      2009  61  6,815,963  139  9,364,656  123  1,013,093  5  5,979  1  20  17  189,915  346  17,389,626

                      2010  46  5,870,554  115  6,881,397  116  894,973  4  5,923  2  31  18  281,084  301  13,933,962
                      2011  54  5,182,280  137  5,710,140  113  1,003,875  3  4,025  2  30  20  296,183  329  12,196,533

                      2012  53  4,509,491  146  6,711,965  115  960,004  3  4,348  1  20  22  498,230  340  12,684,058

                      2013  64  4,149,722  161  7,201,090  134  988,939  4  5,512  1  20  25  166,494  389  12,511,777

                      2014  72  3,705,462  155  7,607,454  121  962,552  6  8,440  0  0  27  332,558  381  12,616,466

                      2015  123  5,808,339  163  7,548,124  146  1,137,717  3  3,234  0  0  22  226,082  457  14,723,496
                      2016  58  4,122,437  152  6,773,750  146  1,363,462  9  6,078  2  19  29  422,944  396  12,688,690

                      2017  47  3,459,630  189  8,796,311  152  1,253,072  4  3,103  1  20  28  317,449  421  13,829,585


                     Table 12   Number of certified laboratories and statistics of certified items every year


                                 Certified food    Certified medicated   Certified drug abuse   GLP-certified trial site
                                  laboratories    cosmetics laboratories  testing laboratories
                       Year
                              Number of   Number of   Number of   Number of   Number of  Number of   Number of   Number of
                                sites    Items     sites     Items     sites    Items     sites     Items
                       2008     18       280        3         16       13        9         1         3
                       2009     23       298        7         55       13        9         8         16
                       2010     41       421        24       230       13        9         9         19
                       2011     55       481        26       248       13        9         16        26
                       2012     61       637        29       405       13        9         18        42
                       2013     58       632        31       536       13        9         20        58
                       2014     61       665        30       488       14        9         17        49
                       2015     72       789        30       370       15        9         15        53
                       2016     81       1,046      34       379       14        9         15        44

                       2017     87       1,124      37       367       14        9         14        55


                                                                                                          133