
Page 130 - 2018食藥署年報(英文版)
P. 130
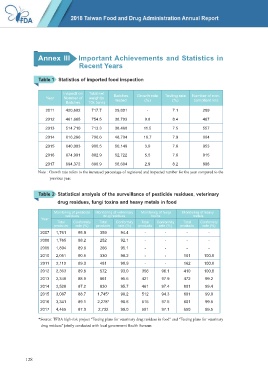
Annex III   Important Achievements and Statistics in
                                    Recent Years


                  Table 1   Statistics of imported food inspection


                             Inspecti on  Total net
                     Year    Number of   weight(x   Batches   Growth rate   Testing rate   Number of non-
                                                    tested
                                                                              (%)
                                                                                       compliant lots
                                                                 (%)
                              Batches   10k tons)
                     2011     420,602     717.7     29,801        -           7.1          289
                     2012     461,665     754.5     38,793       9.8          8.4          467
                     2013     514,710     713.3     38,460       11.5         7.5          557
                     2014     616,286     796.6     48,704       19.7         7.9          664

                     2015     640,003     900.5     50,149       3.9          7.8          953
                     2016     674,991     882.9     52,722       5.5          7.8          915

                     2017     694,372     896.9     56,604       2.9          8.2          808
                  Note : Growth rate refers to the increased percentage of registered and inspected number for the year compared to the
                       previous year.


                  Table 2  Statistical analysis of the surveillance of pesticide residues, veterinary
                           drug residues, fungi toxins and heavy metals in food

                         Monitoring of pesticide   Monitoring of veterinary   Monitoring of fungi   Monitoring of heavy
                              residues         drug residues        toxins             metals
                   Year
                          Total   Conformity   Total   Conformity   Total   Conformity   Total   Conformity
                         products  rate (%)  products  rate (%)  products  rate (%)  products  rate (%)
                   2007   1,761     95.9     359       94.4      -        -         -         -
                   2008   1,765     88.2     252       92.1      -        -         -         -
                   2009   1,894     89.6     266       95.1      -        -         -         -
                   2010   2,051     90.5     330       98.2      -        -        161      100.0
                   2011   2,110     89.0     481       90.9      -        -        162      100.0
                   2012   2,363     89.8     572       93.0     356      96.1      410      100.0
                   2013   2,340     88.9     861       95.5     421      97.9      472      99.2
                   2014   2,528     87.2     830       95.7     461      97.4      801      99.4

                   2015   3,087     88.7    1,745*     98.2     512      94.3      601      99.0
                   2016   3,341     89.1    2,278*     98.6     515      97.5      601      99.5
                   2017   4,465     87.0     2,732     99.0     591      97.1      650      99.5

                  *Source: TFDA high-risk project “Testing plans for veterinary drug residues in food” and “Testing plans for veterinary
                   drug residues” jointly conducted with local government Health Bureaus


            128