


 33 / 132

2015 Annual Report
33
Controlled
Drugs
Management
Medical
Devices
Management
Risk Assessment
Management and
Research Outcomes
Cosmetics
Management
Appendix
National
Laboratory and
Testing Network
Risk Communication
and Consumer
Protection
International
Cooperation and
Cross-Strait Exchange
Medicinal
Products
Management
Policy and
Organization
Food
Management
30%
25%
20%
15%
10%
5%
0%
March
November December
June
27.22%
1.20%
0.74%
April
2010
February
2011
August
January
2014
September
July
December
May
October
13.93%
3.50%
4.97%
12%
14%
16%
10%
8%
6%
4%
2%
September
September
September
September
September
January
2010
January
2011
January
2012
January
2013
January
2014
May
May
May
May
May
December
On 22 March 2010, the Executive Yuan established a project for
Increasing the Suppression of
Counterfeit and Inferior Drugs and Illegal Broadcasting Channels
. Relevant central government
departments and agencies as well as local governments have established a
Joint Task Force for
the Suppression of Counterfeit and Inferior Drugs
to audit counterfeit, illegal, and inferior drugs, food
products adulterated with drugs, Traditional Chinese Medicine adulterated with drugs, and other types
of illegal drugs, and have continued to monitor illegal advertisements of food products, medicinal
products, and cosmetics. The following lists the outcome of the measures carried out so far:
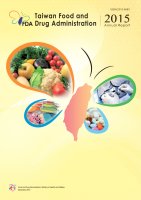
a. Discovery of illegal medicinal products: A total of 1,500 audits were carried out on average every
month. Discovery of illegal drugs was reduced from 27.22% in 2010 to 1.20% in 2014 as shown in
Figure 3-6.
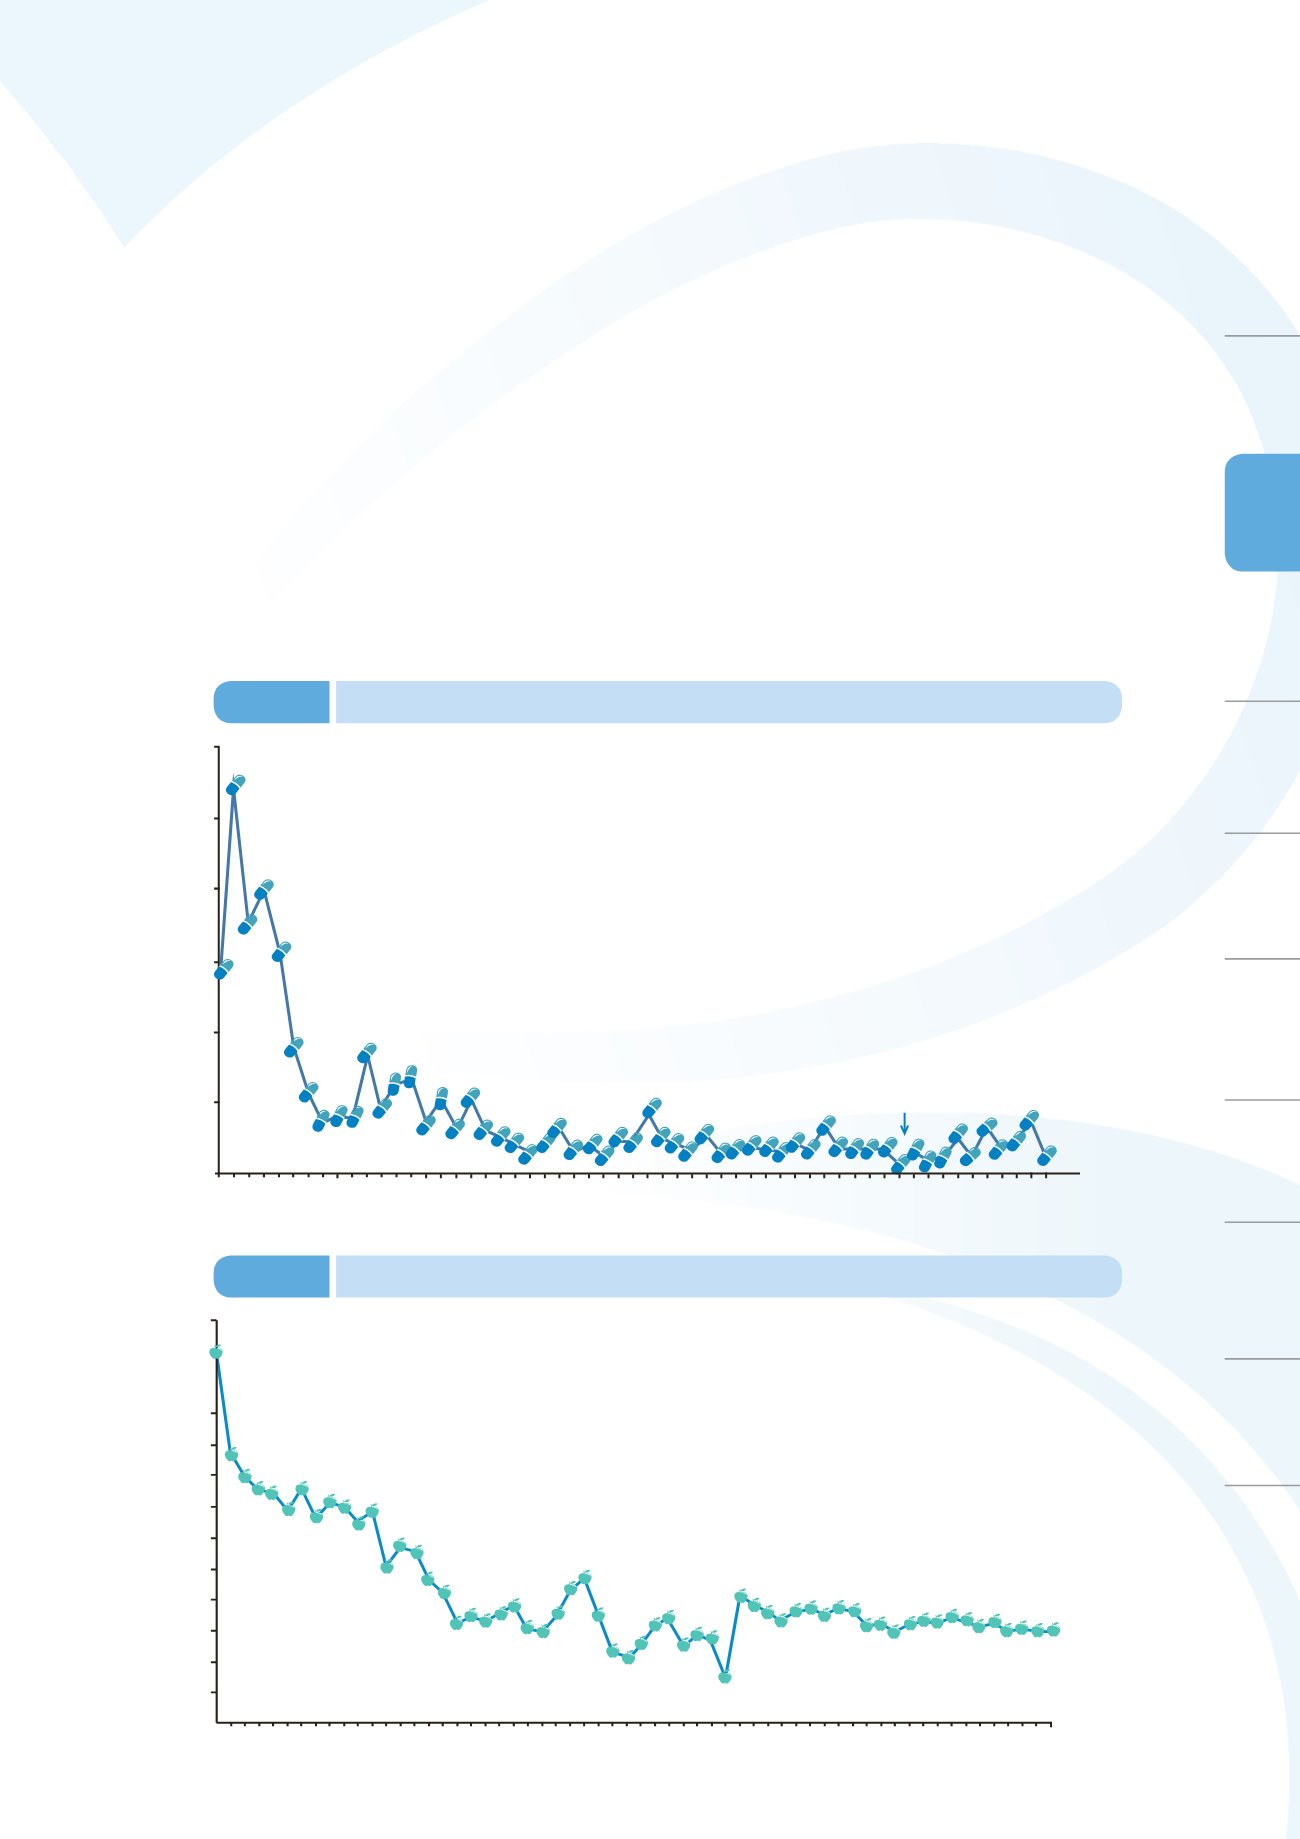
b. Advertisement violation rates: Violation rates of food products, medicinal products, and cosmetics
advertisements decreased from 13.93% in 2010 to 4.97% in 2014 as shown in Figure 3-7.
Figure 3-6
2010-2014 Incedence of illegal drugs
Figure 3-7
2010-2014 Food products and drugs advertisement violation rates from