


 119 / 132

2015 Annual Report
119
Risk Assessment
Management and
Research Outcomes
Cosmetics
Management
Appendix
National
Laboratory and
Testing Network
Risk Communication
and Consumer
Protection
International
Cooperation and
Cross-Strait Exchange
Food
Management
Medicinal
Products
Management
Policy and
Organization
Controlled
Drugs
Management
Medical
Devices
Management
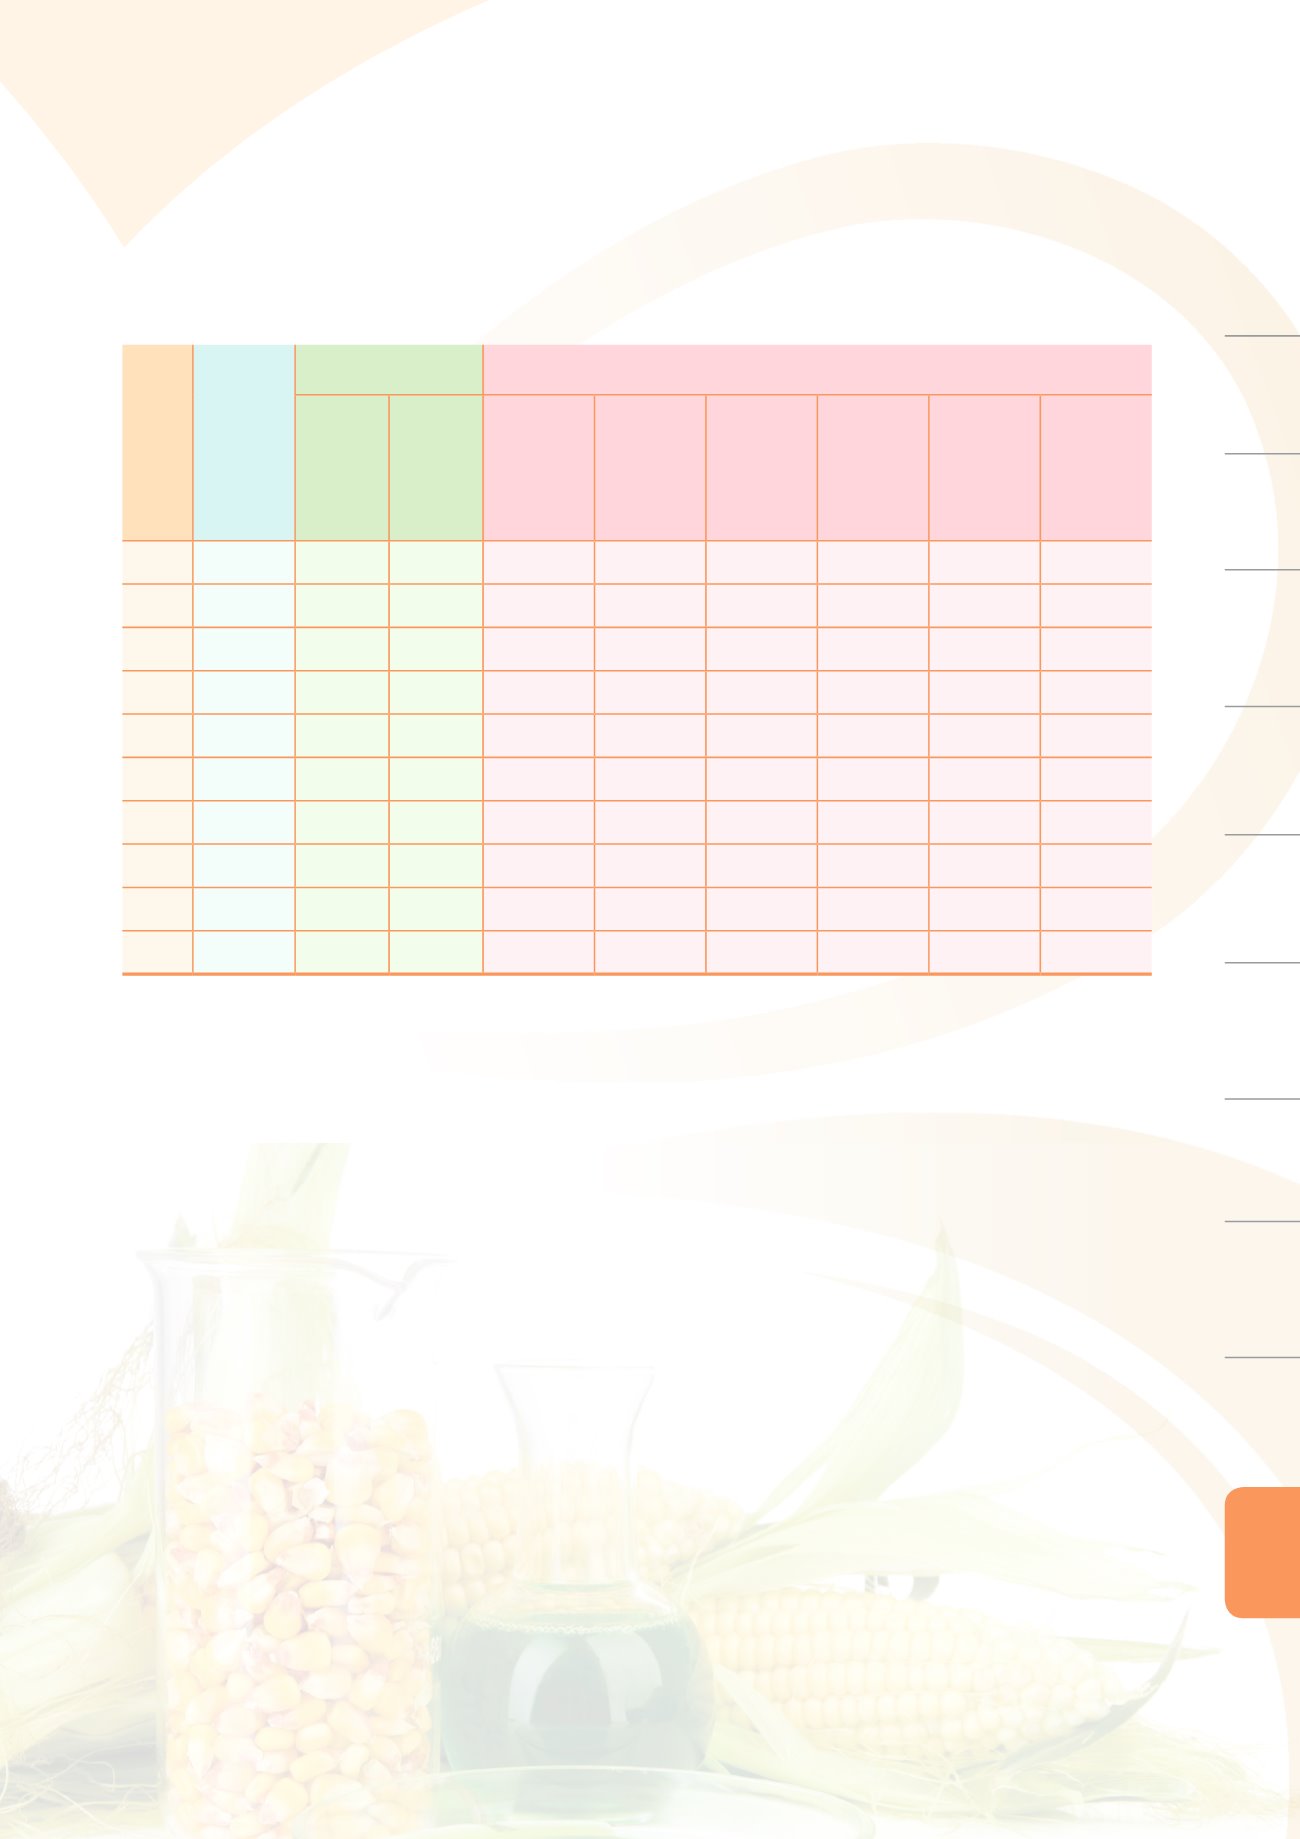
Annex Table 6. Statistics on cases of food poisoning
Year Outbreaks
Foodborne disease
outbreaks incidence
Vehicles identified in foodborne disease outbreaks
Cases deaths
cases
Seafood
produce and
its processed
products
Meat, eggs,
and dairy
and their
processed
products
Cereals,
vegetables,
and fruits
and their
processed
products
Confectionery
and candies
Compound
cooking food
and others
Unknown
causes of
vehicles
2005
247
3,530
1
7
5
4
0
18
213
2006
265
4,401
0
7
7
6
1
20
226
2007
248
3,231
0
4
6
7
0
13
218
2008
272
2,924
0
10
3
2
2
19
236
2009
351
4,642
0
4
2
3
4
43
296
2010
503
6,880
1
12
2
10
4
56
420
2011
426
5,819
1
23
5
9
1
73
315
2012
527
5,701
0
19
8
9
2
66
423
2013
409
3,890
0
10
7
9
1
22
338
2014
480
4,504
0
18
12
6
3
60
381
Note: Total cases of vehicles responsible for foodborne disease outbreaks must be deducted to prevent double-counting
of values.