


 123 / 132

2015 Annual Report
123
Risk Assessment
Management and
Research Outcomes
Cosmetics
Management
Appendix
National
Laboratory and
Testing Network
Risk Communication
and Consumer
Protection
International
Cooperation and
Cross-Strait Exchange
Food
Management
Medicinal
Products
Management
Policy and
Organization
Controlled
Drugs
Management
Medical
Devices
Management
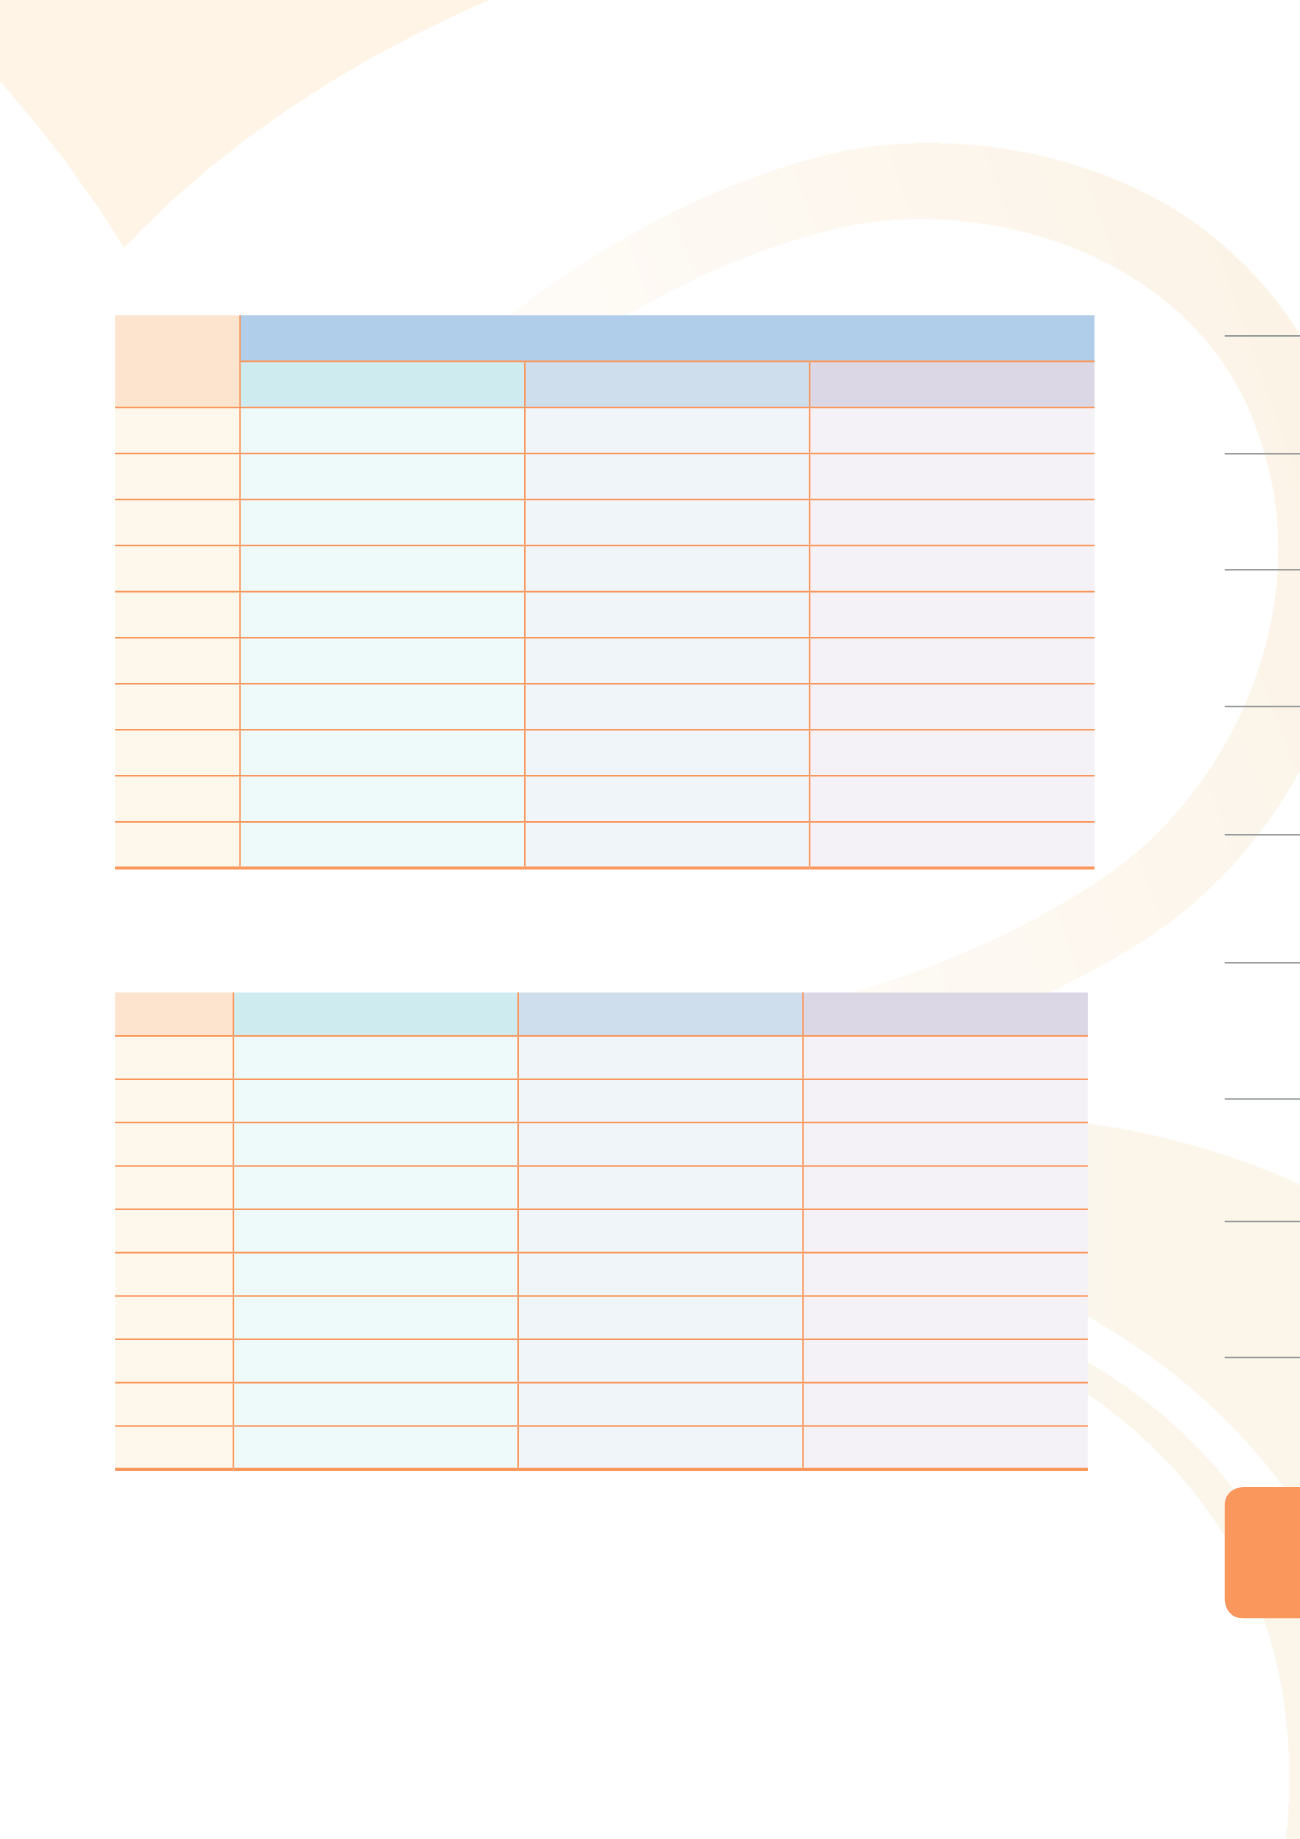
Annex Table 11. Statistics on controlled drug audits
Year
Item
Number of audits
Number of violations
Violation rate (%)
2005
18,164
186
1.02
2006
16,629
306
1.84
2007
16,451
232
1.41
2008
16,241
270
1.66
2009
16,355
245
1.50
2010
15,154
196
1.29
2011
15,270
147
0.96
2012
16,214
202
1.25
2013
16,197
211
1.30
2014
17,057
304
1.78
Annex Table 12. Statistics on independent production and sales of
controlled drugs
Year
Total income
Sales income
Submitted to National Treasury
2005
423,671
419,829
128,771
2006
431,369
426,393
123,385
2007
436,341
433,122
107,105
2008
477,133
470,627
101,441
2009
507,794
505,340
138,473
2010
484,762
483,169
145,956
2011
491,524
489,523
116,414
2012
494,672
491,909
120,000
2013
513,092
510,119
120,000
2014
533,320
527,940
120,000
(Unit: 1000 New Taiwan Dollar)