


 117 / 132

2015 Annual Report
117
Risk Assessment
Management and
Research Outcomes
Cosmetics
Management
Appendix
National
Laboratory and
Testing Network
Risk Communication
and Consumer
Protection
International
Cooperation and
Cross-Strait Exchange
Food
Management
Medicinal
Products
Management
Policy and
Organization
Controlled
Drugs
Management
Medical
Devices
Management
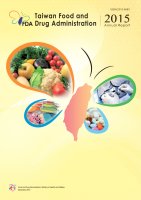
Annex Table 2. Statistics of health food and GM food licenses
Health food license issued (Type 1 and Type 2)
GM food license issued
Year
Type 1 Type 2
Year
Licenses issued
Cumulative licenses
issued in the year
Year
Licenses issued
Cumulative licenses
issued
2005
23
-
23
52
1
12
2006
12
-
12
87
2
14
2007
24
-
24
111
3
17
2008
33
-
33
144
2
19
2009
26
6
32
176
18
37
2010
16
4
20
196
3
40
2011
17
6
23
219
13
53
2012
22
8
30
249
9
62
2013
14
13
27
276
10
72
2014
26
15
41
317
12
84
Note 1: There are two types of registration for health foods
Type 1 (individual case review): Manufacturers must provide testing certificates that demonstrate food safety
and health care effects. The license number must be
Wei Bu Chien Shi Tzu
No. Axxxxx
Type 2 (standard specification review): Product must comply with standard specifications formulated by the
MOHW. The license number must be
Wei Bu Chien Shi Kui Tzu
No. xxxxxx
Note 2: As of December 2014, a total of 317 approved licenses for health food had been issued, of which 265 are Type
1 and 52 are Type 2, while 29 licenses had become invalid (expired, suspended, or merged with other licenses).
A total of six licenses were also issued for changed formulas.
Note 3: As of December 2014, a total of 84 licenses were issued for GM food, which included 10 licenses where
production has stopped or permit extensions have not been submitted.
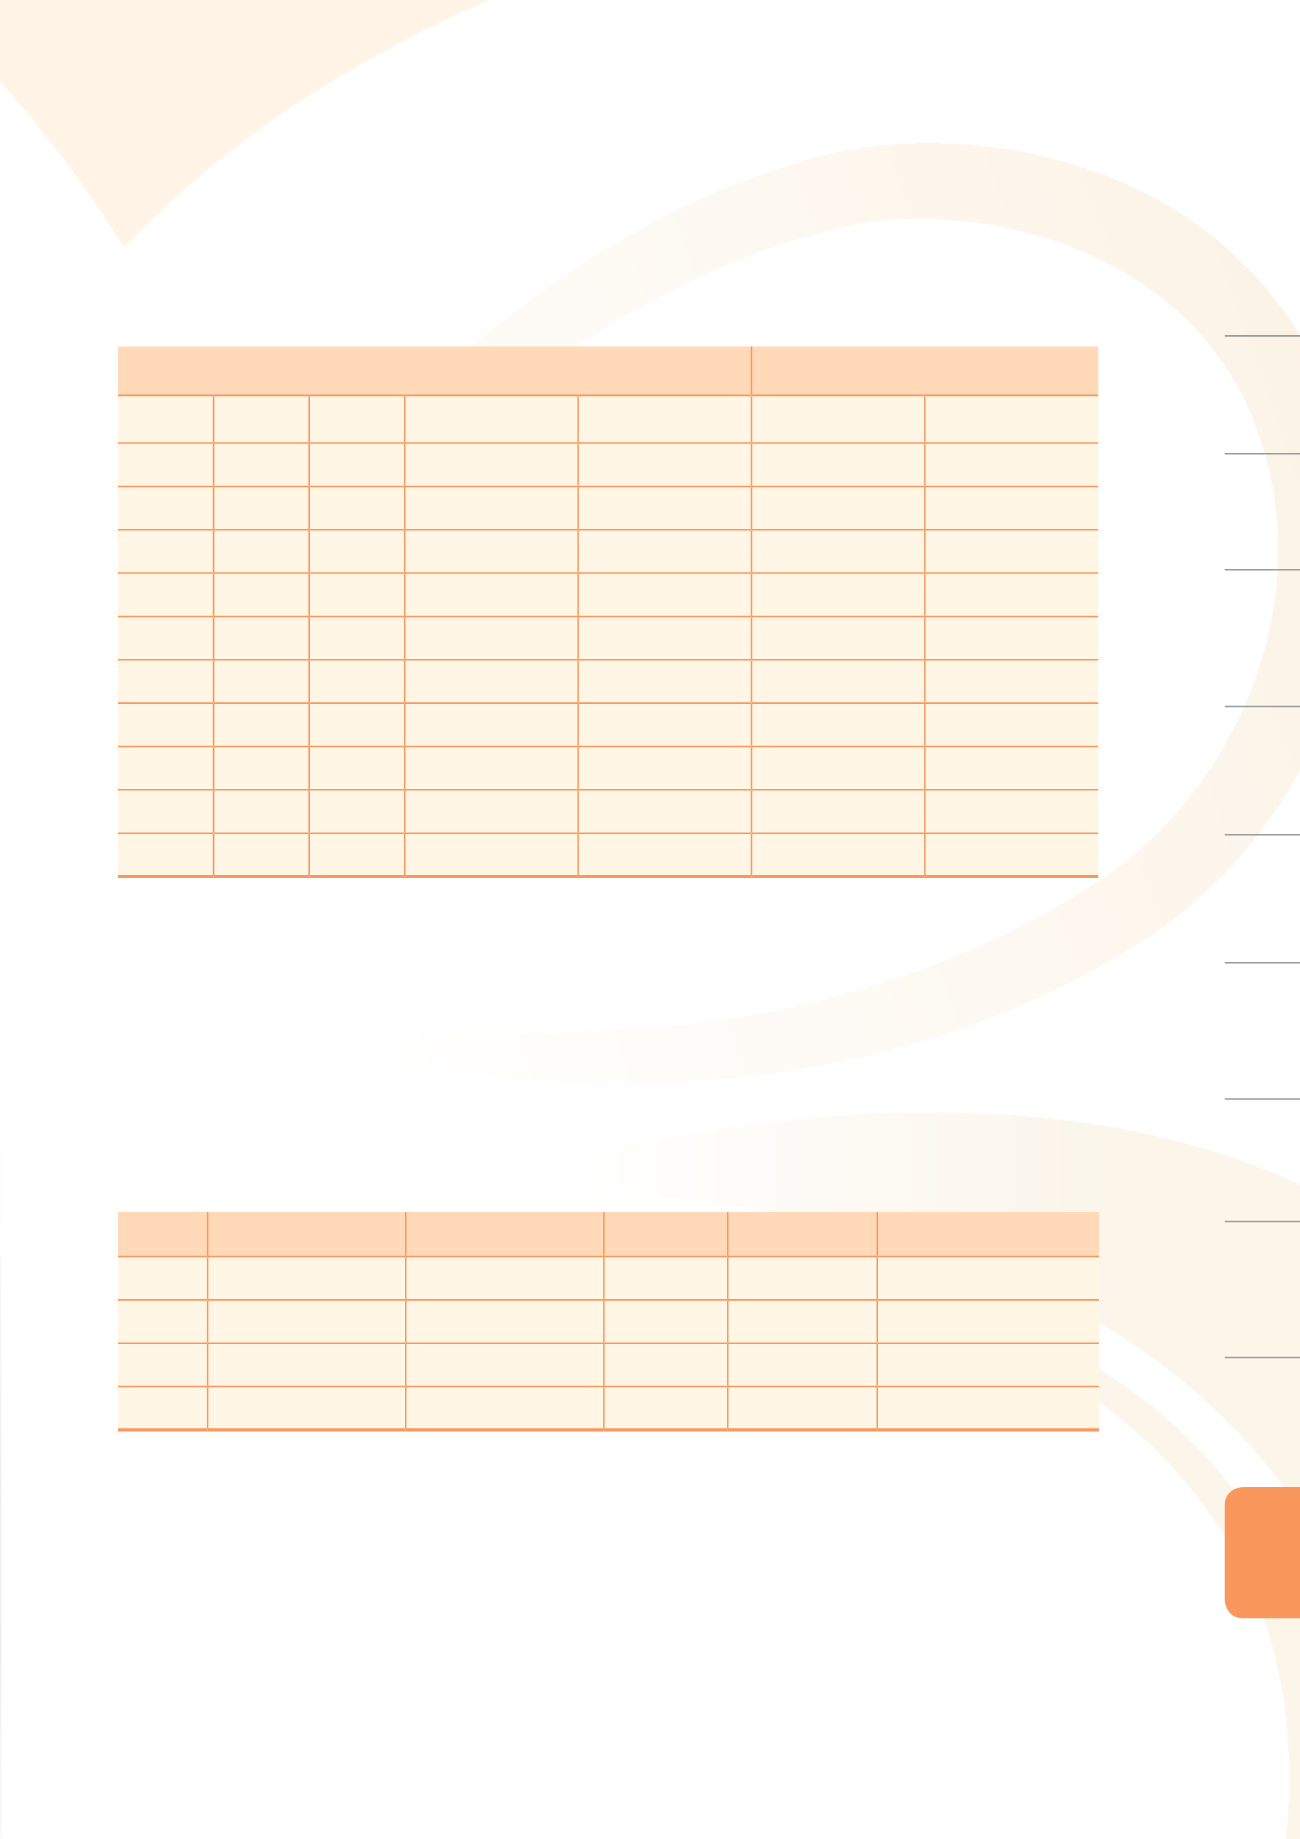
Annex Table 3. Import food inspection statistics
Year
Inspected batches
Total net weight
(x 10,000 tons)
Examined
batches
Test ratio (%)
Nonconforming of
Examined batches
2011
420,602
717.7
29,801
7.09
289
2012
461,665
754.5
38,793
8.40
467
2013
514,710
713.3
38,460
7.47
557
2014
616,286
796.6
48,704
7.90
664