Page 124 - Taiwan Food and Drug Administration 2016 Annual Report
P. 124

Taiwan Food and Drug Adminstration


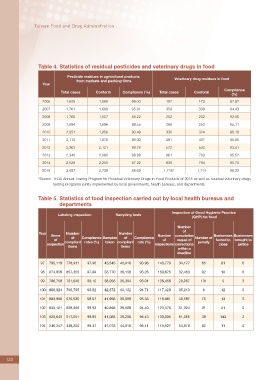
                  Table 4. Statistics of residual pesticides and veterinary drugs in food

                               Pesticide residues in agricultural products
                                                                              Veterinary drug residues in food
                                    from markets and packing firms
                    Year
                                                                                                     Compliance
                            Total cases     Conform    Compliance (%)   Total cases    Conform
                                                                                                        (%)
                    2006      1,605          1,589          99.00          197           173           87.82
                    2007      1,761          1,689          95.91          359           339           94.43
                    2008      1,765          1,557          88.22          252           232           92.06
                    2009      1,894          1,696          89.55          266           253           95.11
                    2010      2,051          1,856          90.49          330           324           98.18
                    2011      2,110          1,878          89.00          481           437           90.85
                    2012      2,363          2,121          89.76          572           532           93.01
                    2013      2,340          2,080          88.89          861           703           95.52

                    2014      2,528          2,205          87.22          830           794           95.70
                    2015      3,087          2,738          88.69         1,745*         1,714         98.22
                  *Source: TFDA Annual Testing Program for Residual Veterinary Drugs in Food Products of 2015 as well as residual veterinary drugs
                         testing programs jointly implemented by local governments, health bureaus, and departments.


                  Table 5. Statistics of food inspection carried out by local health bureaus and
                           departments
                                                                             Inspection of Good Hygienic Practice
                           Labeling inspection      Sampling tests
                                                                                       (GHP) for food
                                                                                Number
                                                                                  of
                  Year        Number                  Number
                        Items                                          Number  consulation      Businesses Businesses
                                 of   Compliance Samples   of   Compliance              Number of
                         of                                              of     requst of        forced to  brought to
                      inspection compliant  rates (%)  taken compliant  rate (%)  inspections corrections   penalty  close  justice
                               items                   items
                                                                                within a
                                                                                deadline
                   97  795,119  778,931  97.96  43,545  40,916  93.96  143,779  34,177     65      81        6
                   98  874,959  857,355  97.99  38,770  36,158  93.26  150,675  32,463     92      18        6
                   99  796,758  781,645  98.10  38,056  35,394  93.01  136,456  28,967    131       5        3

                   100 806,324  796,795  98.82  42,372  40,132  94.71  117,420  35,013     6       12        0
                   101 683,956  676,930  98.97  41,956  39,998  95.33  118,681  49,587     75      13        0

                   102 635,121  628,266  98.92  40,898  38,608  94.40  123,476  51,324     31      21        0
                   103 523,045  517,051  98.85   41,085   39,206  95.43   130,005   61,066   38    143       2

                   104 340,347  338,200  99.37  47,078  44,916  95.41  119,927  54,979     82      11        0


    122
   119   120   121   122   123   124   125   126   127   128   129