Page 128 - Taiwan Food and Drug Administration 2016 Annual Report
P. 128

Taiwan Food and Drug Adminstration


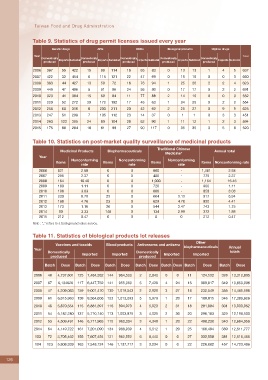
                Table 9. Statistics of drug permit licenses issued every year
                        Genetic drugs       APIs              NCEs         Biological products  Orphan drugs
                Year                                                                                         Total
                   Domestically      Domestically      Domestically     Domestically      Domestically
                           Imports Subtotal  Imports Subtotal  Imports Subtotal  Imports Subtotal  Imports Subtotal
                    produced          produced          produced         produced          produced
                2006  367    55  422    15    99  114    18    65   83     0     13   13     1      4    5   637
                2007  422    32  454    6    115  121    22    47   69     0     16   16     0      0    0   660
                2008  383    44  427    13    59   72    18    76   94     1     25   26     2      2    4   623
                2009  449    47  496    5     91   96    24    56   80     0     17   17     0      2    2   691
                2010  323    41  364    15    69   84    11    77   88     2     14   16     0      0    0   552
                2011  220    52  272    20   172  192    17    46   63     1     24   25     0      2    2   554
                2012  256    60  316    8    203  211    20    42   62     2     25   27     0      9    9   625
                2013  247    51  298    7    105  112    23    14   37     0      1    1     0      3    3   451
                2014  263   122  385    24    80  104    28    62   90     1     11   12     1      2    3   594
                2015  175    86  264    18    81   99    27    90   117    0     35   35     3      5    8   520


                Table 10. Statistics on post-market quality surveillance of medicinal products
                                                                       Traditional Chinese
                            Medicinal Products   Biopharmaceuticals                             Annual total
                                                                          Medicine*
                  Year
                                 Nonconforming        Nonconforming         Nonconforming
                          Items                Items                Items                  Items  Nonconforming rate
                                     rate                 rate                  rate
                  2006     621       2.58        0         0         860         -         1,481       2.58
                  2007     295       2.37        0         0         480         -         775         2.37
                  2008     164       16.46       0         0        1,000        -         1,164      16.46
                  2009     180       1.11        0         0         720         -         900         1.11
                  2010     198       3.03        0         0         660         -         858         3.03
                  2011     230       8.70       23         0         664        3.13       917         6.94
                  2012     168       4.76       23         0         629        4.70       820         4.41
                  2013     173       1.16       26         0         544        3.47       743         1.75
                  2014     90        3.33       148        0         134        2.99       372         1.88
                  2015     212       0.47        0         0          0          0         212         0.47
                Note : "_" refers to a background value survey.

                Table 11. Statistics of biological products lot releases
                                                                                        Other
                          Vaccines and toxoids  Blood products  Antivenoms and antisera
                                                                                   biopharmaceuticals  Annual
                Year
                      Domestically   Imported      Imported   Domestically   Imported  Imported        totals
                        produced                               produced
                     Batch  Dose   Batch  Dose  Batch  Dose  Batch Dose Batch Dose Batch   Dose    Batch  Dose

                2006  48   4,737,601  123  7,484,332  144  964,500  2  2,840  0  0  11    124,532  328  13,312,805
                2007  67   6,134626  117  6,447,752  141  955,060  5  7,429  4  24  15    309,017  349  13,853,908
                2008  47   4,209,083  159  9,001,470  130  1,019,543  2  2,926  3  27  14  232,549  355  14,465,598
                2009  61   6,815,963  139  9,364,656  123  1,013,093  5  5,979  1  20  17  189,915  346  17,389,626
                2010  46   5,870,554  115  6,881,397  116  894,973  4  5,923  2  31  18   281,084  301  13,933,962
                2011  54   5,182,280  137  5,710,140  113  1,003,875  3  4,025  2  30  20  296,183  329  12,196,533

                2012  53   4,509,491  146  6,711,965  115  960,004  3  4,348  1  20  22   498,230  340  12,684,058
                2014  64   4,149,722  161  7,201,090  134  988,939  4  5,512  1  20  25   166,494  389  12,511,777
                 103  72   3,705,462  155  7,607,454  121  962,552  6  8,440  0  0  27    332,558  381  12,616,466
                 104  123  5,808,339  163  7,548,124  146  1,137,717  3  3,234  0  0  22  226,082  457  14,723,496


    126
   123   124   125   126   127   128   129   130   131   132   133