Page 130 - 2021 Taiwan Food and Drug Administration Annual Report
P. 130

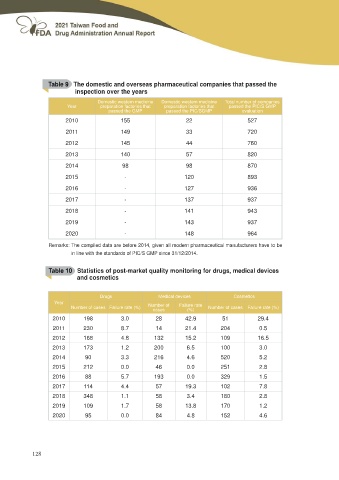
Table 9 The domestic and overseas pharmaceutical companies that passed the
                 inspection over the years

           Year       Domestic western medicine    Domestic western medicine    Total number of companies
                       preparation factories that   preparation factories that    passed the PIC/S GMP
                             passed the GMP           passed the PIC/SGMP                  evaluation

           2010       155                               22                           527

           2011       149                               33                           720

           2012       145                               44                           760

           2013       140                               57                           820

           2014       98                                98 870

           2015       -                                 120 893

           2016       -                                 127 936

           2017       -                                 137 937

           2018       -                                 141 943

           2019       -                                 143 937

           2020       -                                 148 964

     Remarks: The compiled data are before 2014, given all modern pharmaceutical manufacturers have to be
                  in line with the standards of PIC/S GMP since 31/12/2014.

     Table 10 Statistics of post-market quality monitoring for drugs, medical devices
                  and cosmetics

                              Drugs                Medical devices                   Cosmetics
           Number of cases Failure rate (%)
     Year                                    Number of  Failure rate
                                                cases        (%)
                                                                      Number of cases Failure rate (%)

     2010        198  3.0                          28 42.9                      51              29.4
     2011        230  8.7
     2012        168  4.8                          14 21.4                      204             0.5
     2013        173  1.2
     2014        90   3.3                          132 15.2                     109             16.5
     2015        212  0.0
     2016        88   5.7                          200 6.5                      100             3.0
     2017        114  4.4
     2018        348  1.1                          216 4.6                      520             5.2
     2019        109  1.7
     2020        95   0.0                          46 0.0                       251             2.8

                                                   193 0.0                      329             1.5

                                                   57 19.3                      102             7.8

                                                   58 3.4                       180             2.8

                                                   58 13.8                      170             1.2

                                                   84 4.8                       152             4.6

128
   125   126   127   128   129   130   131   132   133   134   135