
Page 132 - 2021 Taiwan Food and Drug Administration Annual Report
P. 132
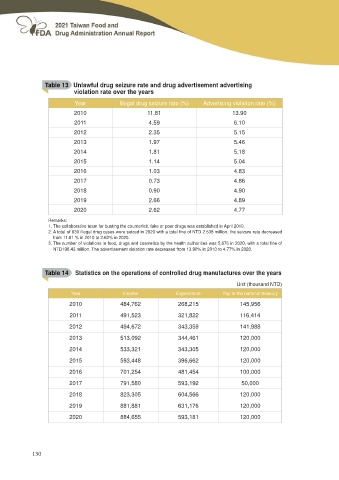
Table 13 Unlawful drug seizure rate and drug advertisement advertising
                   violation rate over the years

     Year  Illegal drug seizure rate (%)  Advertising violation rate (%)
     2010                11.81                           13.90
     2011                 4.59                            6.10
     2012                 2.35                            5.15
     2013                 1.97                            5.46
     2014                 1.81                            5.18
     2015                 1.14                            5.04
     2016                 1.03                            4.83
     2017                 0.73                            4.86
     2018                 0.90                            4.90
     2019                 2.66                            4.89
     2020                 2.62                            4.77

     Remarks:
     1. The collaborative team for busting the counterfeit, fake or poor drugs was established in April 2010.
        $ WRWDO RI     LOOHJDO GUXJ FDVHV ZHUH VHL]HG LQ      ZLWK D WRWDO ¿QH RI 17'       PLOOLRQ  WKH VHL]XUH UDWH GHFUHDVHG

        from 11.81 % in 2010 to 2.62% in 2020.
        7KH QXPEHU RI YLRODWLRQV LQ IRRG  GUXJV DQG FRVPHWLFV E\ WKH KHDOWK DXWKRULWLHV ZDV       LQ       ZLWK D WRWDO ¿QH RI

        NTD198.43 million. The advertisement violation rate decreased from 13.90% in 2010 to 4.77% in 2020.

     Table 14 Statistics on the operations of controlled drug manufactures over the years

     Year  Income   Expenditure                   Unit (thousand NTD)
                                          Pay to the national treasury

     2010  484,762  268,215               145,956

     2011  491,523  321,822               116,414

     2012  494,672  343,359               141,988

     2013  513,092  344,461               120,000

     2014  533,321  343,305               120,000

     2015  593,448  396,662               120,000

     2016  701,254  481,454               100,000

     2017  791,580  593,192               50,000

     2018  823,305  604,566               120,000

     2019  881,881  631,176               120,000

     2020  884,655  593,181               120,000

130