
Page 128 - 2021 Taiwan Food and Drug Administration Annual Report
P. 128
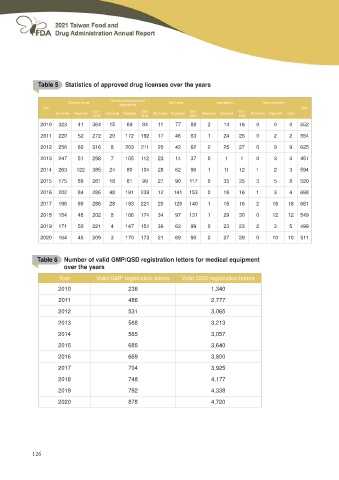
Table 5 Statistics of approved drug licenses over the years

           Generic drugs             Active pharmaceutical                  New drug                      Biologicals                   Rare medicine
                                            ingredients        Domestic Imported             Domestic Imported                Domestic Imported Sum

     Year                                                                                                                                              Total

           Domestic Imported  Sub-   Domestic Imported  Sub-                          Sub-                             Sub-
                              total                     total                         total                            total

2010 323 41 364 15 69 84 11 77 88 2                                                          14 16 0                          0 0 552

2011 220 52 272 20 172 192 17 46 63 1                                                        24 25 0                          2 2 554

2012 256 60 316 8 203 211 20 42 62 2                                                         25 27 0                          9 9 625

2013 247 51 298 7 105 112 23 14 37 0                                                         11 0                             3 3 451

2014 263 122 385 24 80 104 28 62 90 1 11 12 1                                                                                 2 3 594

2015 175 86 261 18 81 99 27 90 117 0 35 35 3                                                                                  5 8 520

2016 202 84 286 48 191 239 12 141 153 0 16 16 1                                                                               3 4 698

2017 196 90 286 28 193 221 20 120 140 1                                                      15 16 2                          16 18 681

2018 154 48 202 8 166 174 34 97 131 1                                                        29 30 0                          12 12 549

2019 171 50 221 4 147 151 36 63 99 0 23 23 2                                                                                  3 5 499

2020 164 45 209 3 170 173 21 69 90 2                                                         27 29 0                          10 10 511

Table 6 Number of valid GMP/QSD registration letters for medical equipment
            over the years

           Year               Valid GMP registration letters Valid QSD registration letters

           2010                      236                                                     1,340

           2011                      486                                                     2,777

           2012                      531                                                     3,065

           2013                      568                                                     3,213

           2014                      565                                                     3,057

           2015                      685                                                     3,640

           2016                      669                                                     3,800

           2017                      704                                                     3,925

           2018                      748                                                     4,177

           2019                      792                                                     4,338

           2020                      878                                                     4,720

126