
Page 129 - 2021 Taiwan Food and Drug Administration Annual Report
P. 129
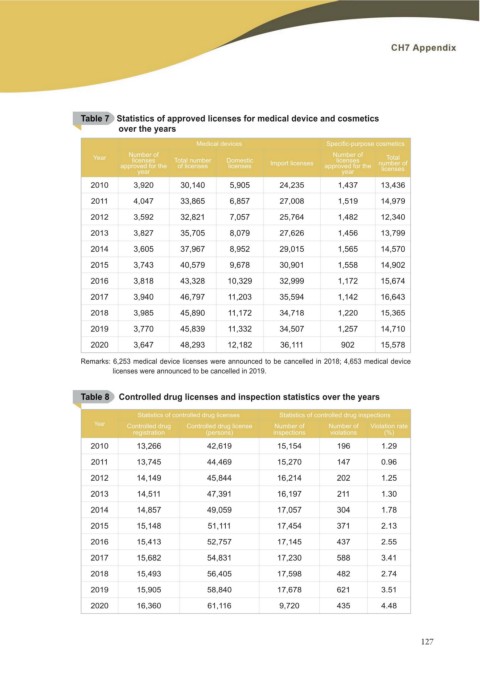
Table 7 Statistics of approved licenses for medical device and cosmetics
            over the years

                        Medical devices                           6SHFL¿F SXUSRVH FRVPHWLFV

Year   Number of        Total number  Domestic                       Number of         Total
       licenses                       licenses                         licenses     number of
       approved for the of licenses              Import licenses                     licenses
                                                                  approved for the
       year                                                               year

2010   3,920            30,140        5,905      24,235           1,437             13,436

2011   4,047            33,865        6,857      27,008           1,519             14,979

2012   3,592            32,821        7,057      25,764           1,482             12,340

2013   3,827            35,705        8,079      27,626           1,456             13,799

2014   3,605            37,967        8,952      29,015           1,565             14,570

2015   3,743            40,579        9,678      30,901           1,558             14,902

2016   3,818            43,328        10,329     32,999           1,172             15,674

2017   3,940            46,797        11,203     35,594           1,142             16,643

2018   3,985            45,890        11,172     34,718           1,220             15,365

2019   3,770            45,839        11,332     34,507           1,257             14,710

2020   3,647            48,293        12,182     36,111           902 15,578

Remarks: 6,253 medical device licenses were announced to be cancelled in 2018; 4,653 medical device
             licenses were announced to be cancelled in 2019.

Table 8 Controlled drug licenses and inspection statistics over the years

       Statistics of controlled drug licenses    Statistics of controlled drug inspections

 Year  Controlled drug  Controlled drug license  Number of        Number of Violation rate
         registration            (persons)       inspections
2010                                                              violations        (%)
2011
2012   13,266                   42,619           15,154           196 1.29
2013
2014   13,745                   44,469           15,270           147 0.96
2015
2016   14,149                   45,844           16,214           202 1.25
2017
2018   14,511                   47,391           16,197           211 1.30
2019
2020   14,857                   49,059           17,057           304 1.78

       15,148                   51,111           17,454           371 2.13

       15,413                   52,757           17,145           437 2.55

       15,682                   54,831           17,230           588 3.41

       15,493                   56,405           17,598           482 2.74

       15,905                   58,840           17,678           621 3.51

       16,360                   61,116           9,720            435 4.48

                                                                                                     127