
Page 126 - 2021 Taiwan Food and Drug Administration Annual Report
P. 126
Appendix 3 Important achievements and statistics over the years
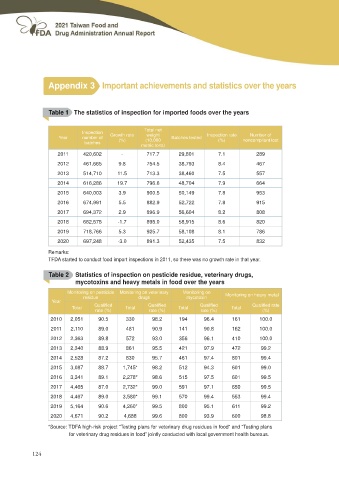
Table 1 The statistics of inspection for imported foods over the years
Year Inspection Growth rate Total net Batches tested Inspection rate Number of
number of (%) weight (%) noncompliant lost
2011 (10,000
2012 batches - metric tons)
9.8
420,602 717.7 29,801 7.1 289
461,665 754.5 38,793 8.4 467
2013 514,710 11.5 713.3 38,460 7.5 557
2014 616,286 19.7 796.6 48,704 7.9 664
2015 640,003 3.9 900.5 50,149 7.8 953
2016 674,991 5.5 882.9 52,722 7.8 915
2017 694,372 2.9 896.9 56,604 8.2 808
2018 682,575 -1.7 895.0 58,915 8.6 820
2019 718,766 5.3 925.7 58,108 8.1 786
2020 697,248 -3.0 891.3 52,435 7.5 832
Remarks:
TFDA started to conduct food import inspections in 2011, so there was no growth rate in that year.
Table 2 Statistics of inspection on pesticide residue, veterinary drugs,
mycotoxins and heavy metals in food over the years
Monitoring on pesticide Monitoring on veterinary Monitoring on Monitoring on heavy metal
residue drugs mycotoxin
Year
4XDOL¿HG 4XDOL¿HG 4XDOL¿HG 4XDOL¿HG UDWH
Total rate (%) Total rate (%) Total rate (%) Total (%)
161
2010 2,051 90.5 330 98.2 194 96.4 100.0
2011 2,110 89.0 481 90.9 141 90.8 162 100.0
2012 2,363 89.8 572 93.0 356 96.1 410 100.0
2013 2,340 88.9 861 95.5 421 97.9 472 99.2
2014 2,528 87.2 830 95.7 461 97.4 801 99.4
2015 3,087 88.7 1,745* 98.2 512 94.3 601 99.0
2016 3,341 89.1 2,278* 98.6 515 97.5 601 99.5
2017 4,465 87.0 2,732* 99.0 591 97.1 650 99.5
2018 4,467 89.0 3,580* 99.1 570 99.4 553 99.4
2019 5,164 90.6 4,260* 99.5 800 95.1 611 99.2
2020 4,671 90.2 4,688 99.6 800 93.9 600 98.8
*Source: TDFA high-risk project “Testing plans for veterinary drug residues in food” and “Testing plans
for veterinary drug residues in food” jointly conducted with local government health bureaus.
124