
Page 62 - 2017食品藥物管理署年報(英文版)
P. 62
2017 Taiwan Food and Drug Administration Annual Report
2. Post-market product quality surveillance
In 2016, a total of 14 PMS plans were implemented, including six for food products,
one for medicinal product, five for medical devices, and two for cosmetics. Conforming
rates for food products, drugs, medical devices and cosmetics were 94.1%, 94.3%,
98.4% and 98.5% respectively. Cases of nonconforming products were transferred to the
responsible local health bureaus and departments to pursue subsequent legal actions as
well as source control.
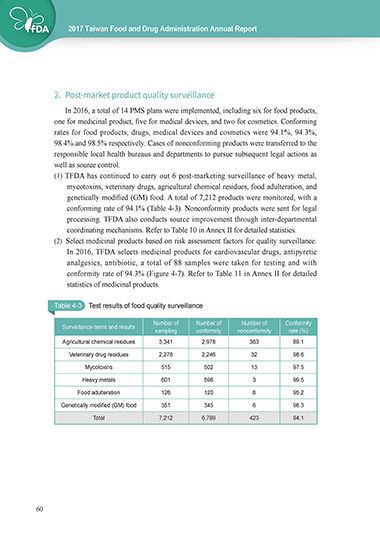
(1) TFDA has continued to carry out 6 post-marketing surveillance of heavy metal,
mycotoxins, veterinary drugs, agricultural chemical residues, food adulteration, and
genetically modified (GM) food. A total of 7,212 products were monitored, with a
conforming rate of 94.1% (Table 4-3). Nonconformity products were sent for legal
processing. TFDA also conducts source improvement through inter-departmental
coordinating mechanisms. Refer to Table 10 in Annex II for detailed statistics.
(2) Select medicinal products based on risk assessment factors for quality surveillance.
In 2016, TFDA selects medicinal products for cardiovascular drugs, antipyretic
analgesics, antibiotic, a total of 88 samples were taken for testing and with
conformity rate of 94.3% (Figure 4-7). Refer to Table 11 in Annex II for detailed
statistics of medicinal products.
Table 4-3 Test results of food quality surveillance
Number of Number of Number of Conformity
Surveillance items and results
sampling conformity nonconformity rate (%)
Agricultural chemical residues 3,341 2,978 363 89.1
Veterinary drug residues 2,278 2,246 32 98.6
Mycotoxins 515 502 13 97.5
Heavy metals 601 598 3 99.5
Food adulteration 126 120 6 95.2
Genetically modified (GM) food 351 345 6 98.3
Total 7,212 6,789 423 94.1
60
60