
Page 38 - Taiwan Food and Drug Administration 2016 Annual Report
P. 38
Taiwan Food and Drug Adminstration
Section 3. Medicinal Products Quality Chain Monitoring
Current Status
After a medicinal product is approved and marketed, uncertainties such as post-approval
changes, distribution and storage environments may affect product quality. Therefore it is
essential to establish a comprehensive post-marketing supply chain quality monitoring system in
order to ensure the quality of medicinal products.
Policies and Outcomes
1. Quality Monitoring of Medicinal Products
(1) Reporting System of Medical Product Defects
A Reporting System of Medical Product Defects was established in 2004 so that healthcare
professionals and the general public may immediately report any medicinal products with
suspected defects and facilitate subsequent investigation and handling of the incident. A total of
943 reports were received in 2015, of which recalls were initiated for 16 medicinal products.
(2) Quality Monitoring of Medical Products Released to the Market
Quality monitoring items have been selected in response to medicinal product management and
policies, risk assessment factors, and requirements of local health bureaus in order to safeguard
the quality and safety of medicinal product usage by the general public. In 2015, a total of
212 random samples were taken for testing, of which 211 were compliant with pharmacopoeia
regulations while 1 was found to be nonconforming. An of?cial request has been sent to local health
bureaus in order to handle the incident by law and recall the medicinal product. Table 2-2-2 shows
the results of various monitoring projects. Refer to Table 10 of Annex I for detailed statistics on the
post-market quality surveillance of medicinal products throughout the years.
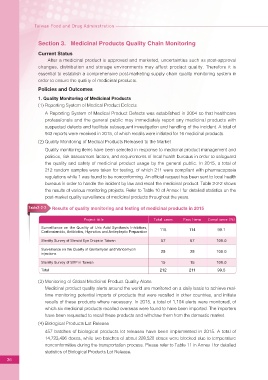
Table2-2-2 Results of quality monitoring and testing of medicinal products in 2015
Project title Total cases Pass Items Compliance (%)
Surveillance on the Quality of Uric Acid Synthesis Inhibitors,
Corticosteroids, Antibiotics, Hypnotics and Antiepileptic Preparation 115 114 99.1
Sterility Survey of Steroid Eye Drops in Taiwan 57 57 100.0
Surveillance on the Quality of Gentamycin and Vancomycin
injections 25 25 100.0
Sterility Survey of SVP in Taiwan 15 15 100.0
Total 212 211 99.5
(3) Monitoring of Global Medicinal Product Quality Alerts
Medicinal product quality alerts around the world are monitored on a daily basis to achieve real-
time monitoring potential imports of products that were recalled in other countries, and initiate
recalls of these products where necessary. In 2015, a total of 1,104 alerts were monitored, of
which six medicinal products recalled overseas were found to have been imported. The importers
have been requested to recall these products and withdraw them from the domestic market.
(4) Biological Products Lot Release
457 batches of biological products lot releases have been implemented in 2015. A total of
14,723,496 doses, while two batches of about 228,520 doses were blocked due to temperature
nonconformities during the transportation process. Please refer to Table 11 in Annex I for detailed
statistics of Biological Products Lot Release.
36