
Page 25 - Taiwan Food and Drug Administration 2016 Annual Report
P. 25
2016 ANNUAL
REPORT
received the largest number of applications (accounting for 55.37% of the total). 640,003
batches of food import inspections were carried out, a ?gure that grew by 3.85% compared
to 2014. Among these, 50,149 batches (7.84% of the total) underwent random sampling and
testing, and 1.90% were found to have failed to conform to the regulations. The number of
nonconformities, in descending order, were fresh, chilled, or frozen vegetables, food utensils,
fresh, chilled, or frozen fruits, and tea products, with most nonconformities pertaining to Part II - Key Administrative Results Food Management
residual agricultural chemicals or heat resistance tests. Such products were either returned or
destroyed according to law to prevent their sales in Taiwanese markets.
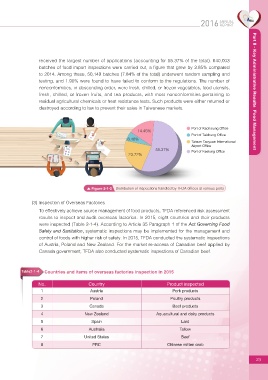
14.45% Port of Kaohsiung Office
Port of Taichung Office
6.46%
Taiwan Taoyuan International
Airport Office
55.37%
23.72% Port of Keelung Office
Figure 2-1-2 Distribution of inspections handled by TFDA of?ces at various ports
(3) Inspection of Overseas Factories
To effectively achieve source management of food products, TFDA referenced risk assessment
results to inspect and audit overseas factories. In 2015, eight countries and their products
were inspected (Table 2-1-4). According to Article 35 Paragraph 1 of the Act Governing Food
Safety and Sanitation, systematic inspections may be implemented for the management and
control of foods with higher risk of safety. In 2015, TFDA conducted the systematic inspections
of Austria, Poland and New Zealand. For the market re-access of Canadian beef applied by
Canada government, TFDA also conducted systematic inspections of Canadian beef.
Table2-1-4 Countries and items of overseas factories inspection in 2015
No. Country Product inspected
1 Austria Pork products
2 Poland Poultry products
3 Canada Beef products
4 New Zealand Aquacultural and dairy products
5 Spain Lard
6 Australia Tallow
7 United States Beef
8 PRC Chinese mitten crab
23