


 125 / 132

2015 Annual Report
125
Risk Assessment
Management and
Research Outcomes
Cosmetics
Management
Appendix
National
Laboratory and
Testing Network
Risk Communication
and Consumer
Protection
International
Cooperation and
Cross-Strait Exchange
Food
Management
Medicinal
Products
Management
Policy and
Organization
Controlled
Drugs
Management
Medical
Devices
Management
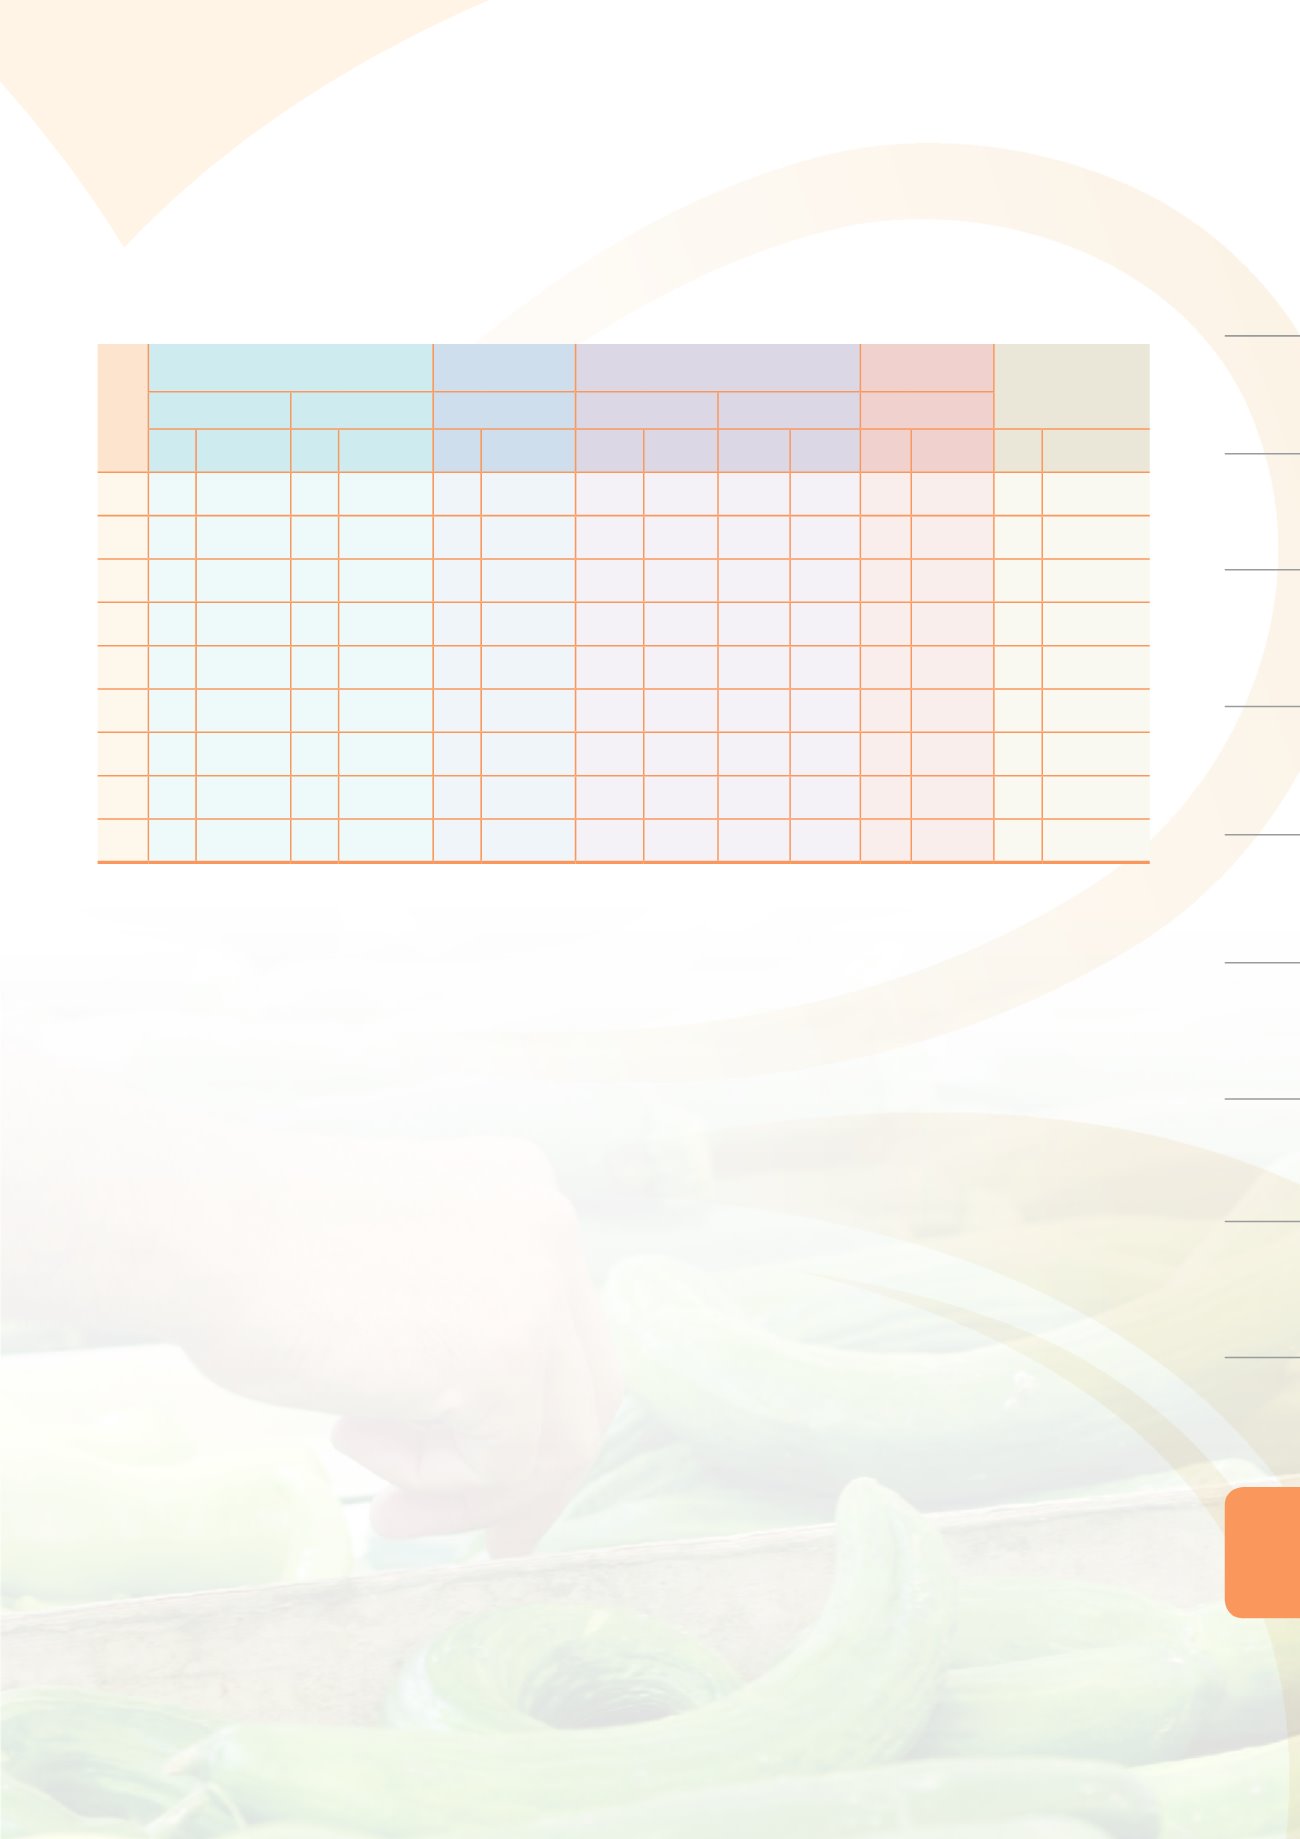
Annex Table 14. Statistics for lot release for biologics
Year
Vaccines and toxoids
Blood products Antitoxins and antiserums Other biologics
Annual total
Domestic
Imported
Imported
Domestic
Imported
Imported
Lots Dose Lots Dose Lots Dose Lots Dose Lots Dose Lots Dose Lots Dose
2006 48 4,737,601 123 7,484,332 144 964,500 2 2,840 0
0 11 123,532 328 13,312,805
2007 67 6,134,626 117 6,447,752 141 955,060 5 7,429 4
24 15 309,017 349 13,853,908
2008 47 4,209,083 159 9,001,470 130 1,019,543 2 2,926 3
27 14 232,549 355 14,465,598
2009 61 6,815,963 139 9,364,656 123 1,013,093 5 5,979 1
20 17 189,915 346 17,389,626
2010 46 5,870,554 115 6,881,397 116 894,973 4 5,923 2
31 18 281,084 301 13,933,962
2011 54 5,182,280 137 5,710,140 113 1,003,875 3 4,025 2
30 20 296,183 329 12,196,533
2012 53 4,509,491 146 6,711,965 115 960,004 3 4,348 1
20 22 498,230 340 12,684,058
2013 64 4,149,722 161 7,201,090 134 988,939 4 5,512 1
20 25 166,494 389 12,511,777
2014 72 3,705,462 155 7,607,454 121 962,552 6 8,440 0
0 27 332,558 381 12,616,466